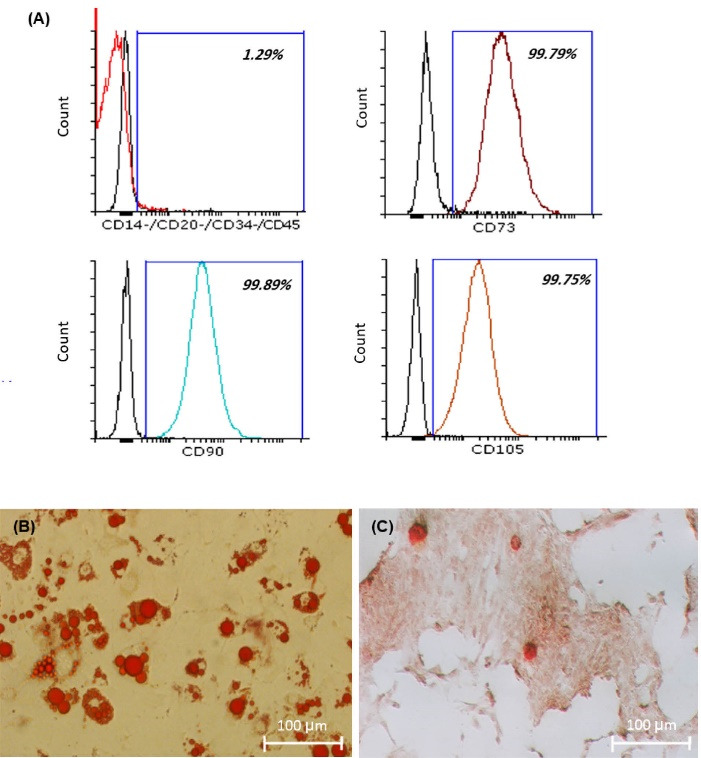
Fig. 3.

Flowcytometry analysis (A). ADSCs were slightly expressed CD 14, CD20, CD 35, and CD45, while significantly expressed CD73, CD90, and CD105. Adipose and osteo differentiation assay (B, C). Fat vacuoles inside the cytoplasm of those cells which differentiate to adipose cells stained by oil red O (B, scale bar: 100 μm), Mineralization of those cell which differentiate to osteo visualized by alizarin red S staining (C, scale bar: 100 μm).
