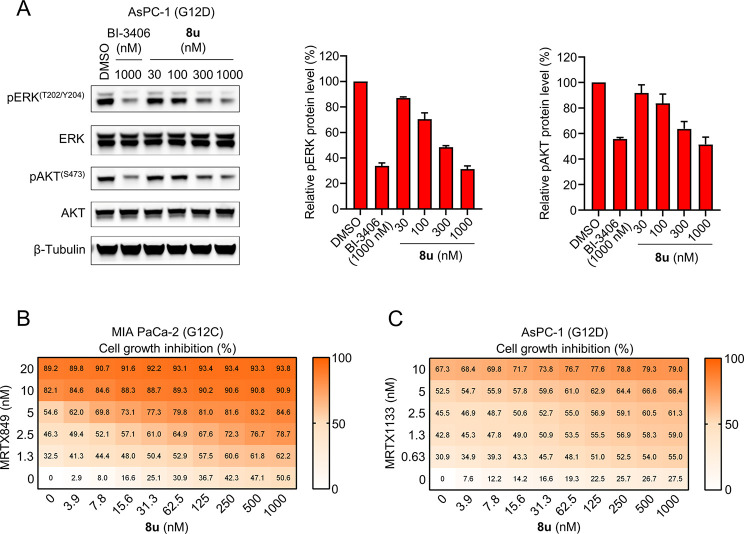
Figure 4.
(A) Representative immunoblots of pERK and pAKT in AsPC-1 (G12D) cells that were treated with the indicated concentration of 8u for 2 h. pERK and pAKT levels were quantified (right panel). Quantified data represent the mean ± SD from two independent biological replicates. (B and C) 3-D antiproliferative activity of 8u in combination with the KRASG12C inhibitor MRTX849 in MIA PaCa-2 cells (B) and KRASG12D inhibitor MRTX1133 in AsPC-1 cells (C). (n = 2; values calculated from the mean).

