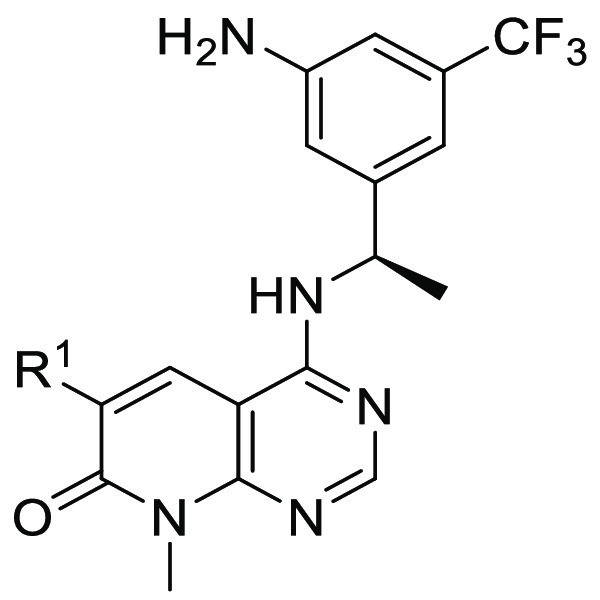
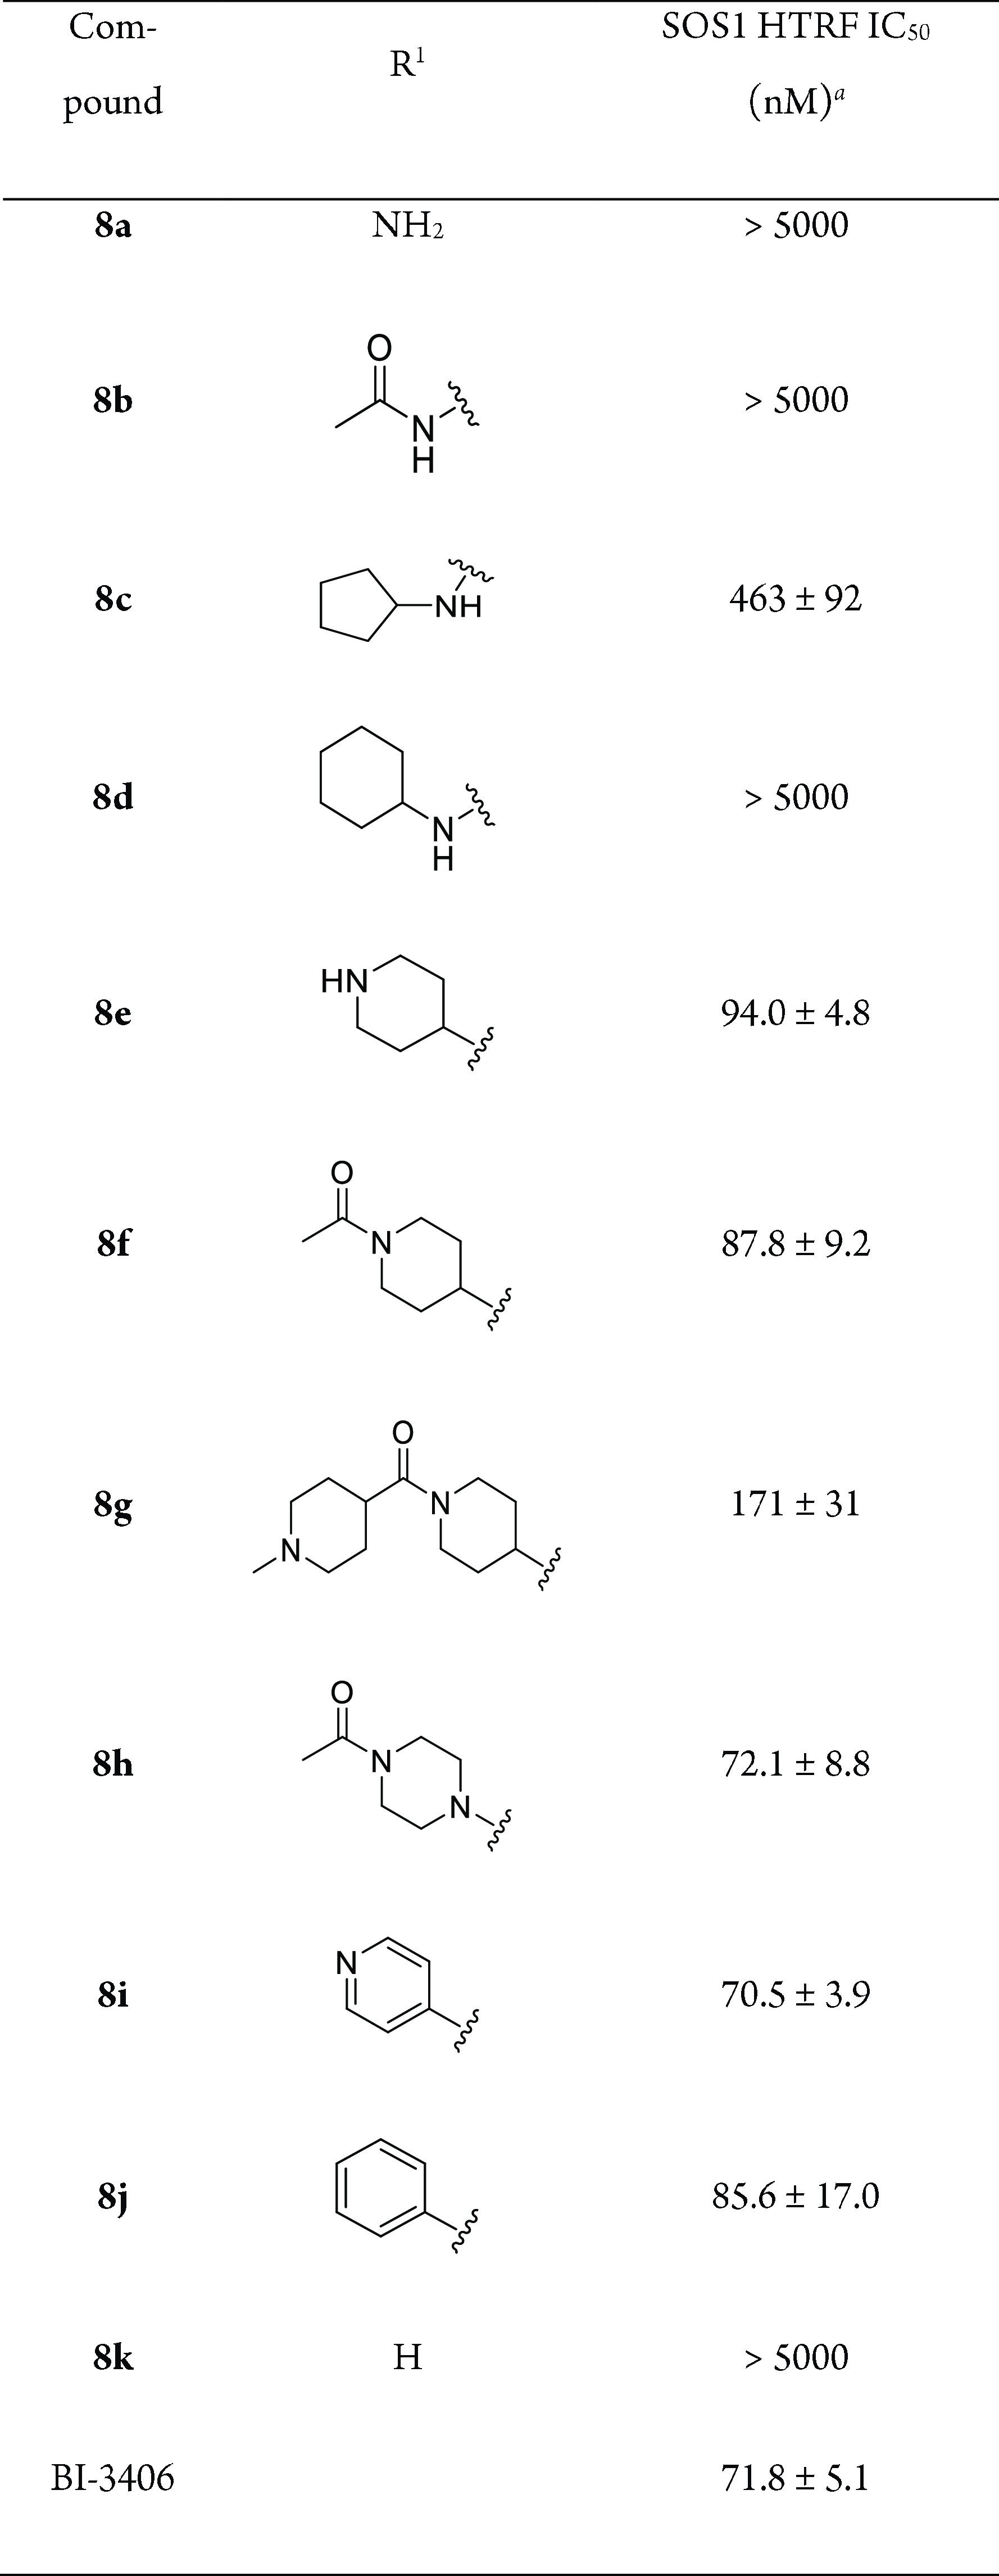
Table 1. Structures and Biochemical Activities of 8a–k with Different R1.


IC50 values are shown as the mean ± standard deviation (SD) from three replicate experiments.


IC50 values are shown as the mean ± standard deviation (SD) from three replicate experiments.