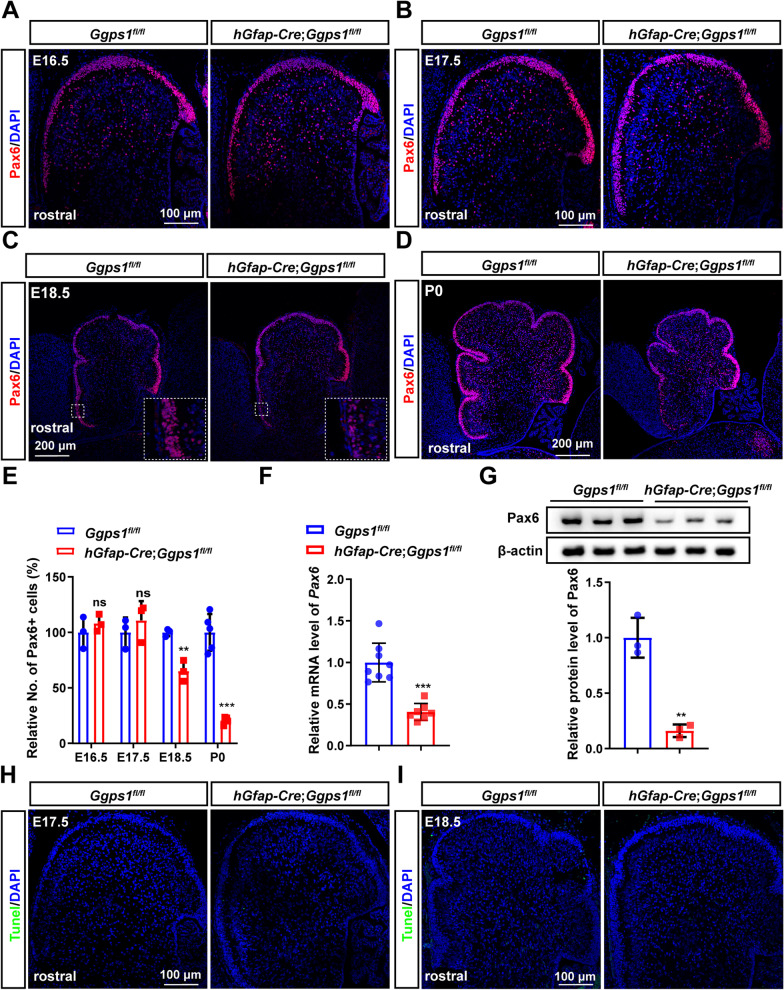
Fig. 5.
Depletion of neural progenitor cells in Ggps1 cKO mice. A–D Representative fluorescence IHC images for Pax6. Pax6 labels NPCs in the EGL of the cerebellum at E16.5 (A), E17.5 (B), E18.5 (C) and P0 (D). The Pax6 + EGL was diminished in the cerebellum of Ggps1 cKO mice at E18.5 and P0. The scale bars were indicated in the images. E The average number of Pax6 + cells in the EGL. There was significant difference between control and Ggps1 cKO mice at E18.5 and P0 (**P = 0.004, ***P = 6.5 × 10⁻⁵, respectively; n = 3 mice per group at E16.5, E17.5, E18.5, n = 5 mice per group at P0). F Quantitative RT-PCR results on Pax6. There was significant reduction on Pax6 mRNA levels in the cerebellum of Ggps1 cKO mice at P0 (***P = 3.0 × 10⁻⁵; n = 8 for WT, n = 7 for cKO). G Western blotting results on Pax6. There was significant reduction on Pax6 levels in the cerebellum of Ggps1 cKO mice (**P = 0.002; n = 3 mice per group). Raw data were shown in Additional file 3: Fig. S3A. H, I Representative fluorescence images for TUNEL staining using sections at E17.5 (H) and E18.5 (I). There were no TUNEL + cells in control or Ggps1 cKO cortices. 3 embryos were examined per group per age. The scale bar is 100 μm

