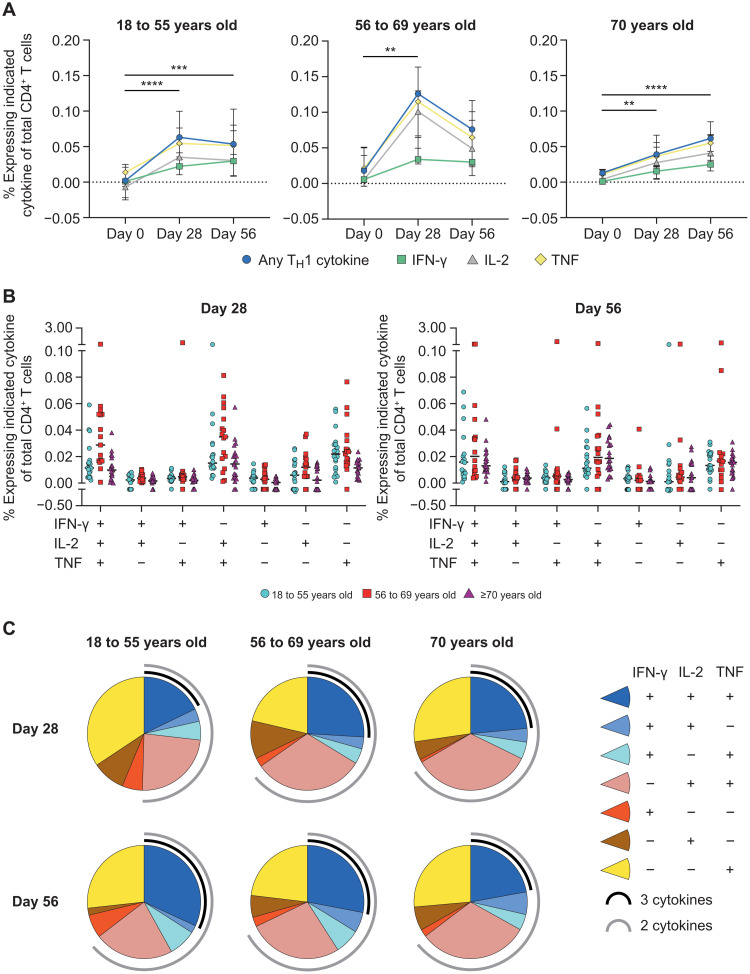
Fig. 2. Age-specific CD4+ T cell responses are observed after AZD1222 vaccination.
(A) Median frequencies with IQRs are shown for CD4+ T cells from participants within each age cohort producing IFN-γ, IL-2, TNF, or any combination of these cytokines at the indicated time points after stimulation with SARS-CoV-2 spike peptide pools. Significant differences between time points within each vaccine group were determined by Kruskal-Wallis tests with Dunn’s test to correct for multiple comparisons. All comparisons are not significant unless stated as significant; **P < 0.01, ***P < 0.001, and ****P < 0.0001. (B) Frequencies of antigen-stimulated CD4+ T cells producing each combination of IFN-γ, IL-2, and TNF cytokines at day 28 (left) or day 56 (right) after vaccination are shown. Individual participant responses are shown with median represented by the horizontal line. (C) Pie graphs indicate the total proportion of spike protein–specific TH1 cytokine production averaged for all participants within the indicated age groups at day 28 and day 56 after vaccination. A proportion of multicytokine responses are represented by the black (three cytokines) and gray (two cytokines) arcs.

