FIGURE 4.

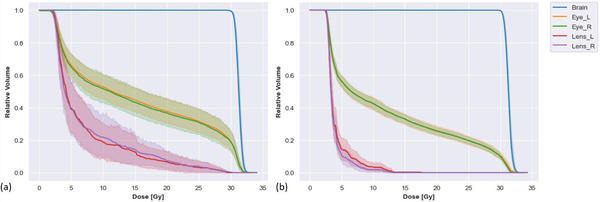
The distribution of the dose‐volume histogram (DVH) for different organs at risk (OARs) (a) for all 17 original plans and (b) for all 17 automatic field‐in‐field (FIF) plans

The distribution of the dose‐volume histogram (DVH) for different organs at risk (OARs) (a) for all 17 original plans and (b) for all 17 automatic field‐in‐field (FIF) plans