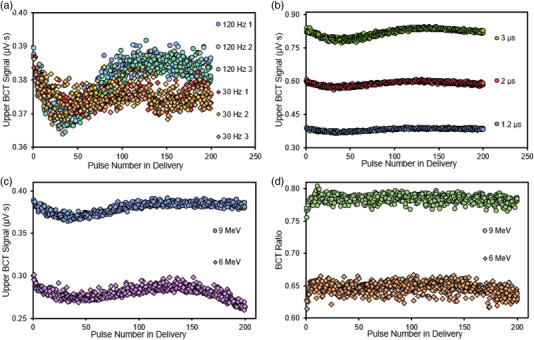
FIGURE 5.

(a) Upper BCT signal for each individual pulse delivered during three 200‐pulse deliveries at a PW of 1.2 µs and PRFs of 120 Hz (circles) and 30 Hz (diamonds) with the 9‐MeV eFLASH beam; each of the three deliveries is denoted by a different color. (b) Upper BCT signal for the 9‐MeV eFLASH beam at a PRF of 120 Hz and PWs of 1.2, 2, and 3 µs; data is combined from three deliveries. (c) Upper BCT signal at a PW of 1.2 µs and a PRF of 120 Hz for 6‐MeV and 9‐MeV eFLASH beams; data is combined from three deliveries. (d) Ratio of lower‐to‐upper BCT signal for each pulse delivered at a PW of 1.2 µs and a PRF of 120 Hz from 6‐MeV and 9 MeV eFLASH beams; data is combined from three deliveries
