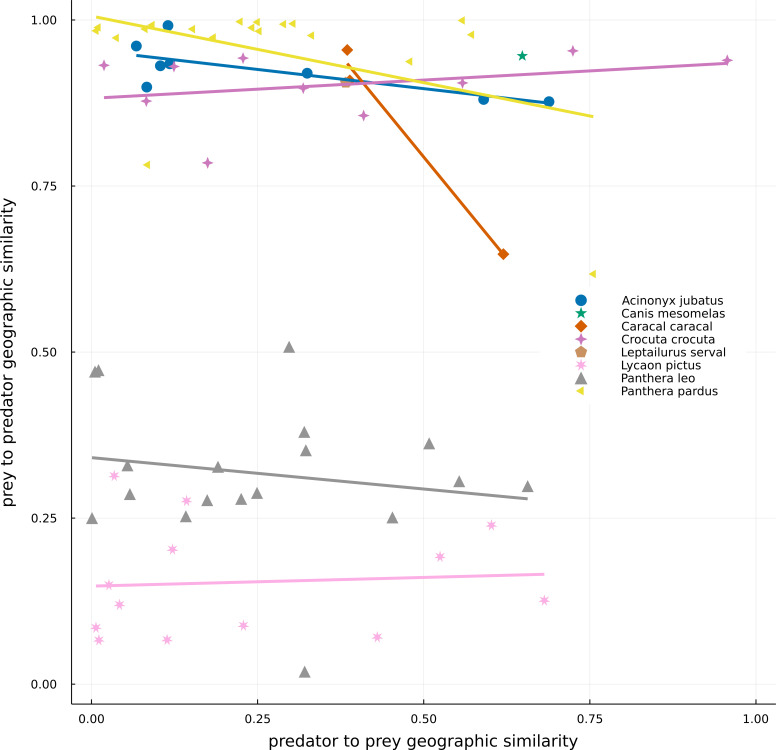
Figure 3. Geographical similarity between the original IUCN range maps of predators and preys.
Dots represent predator–prey pairs, with different symbols corresponding to different predators. For a given pair of species, the number c of pixels where the focal species is present but not the other and the number a of pixels where the predator and prey cooccur, were calculated. Geographic similarities were given by a/(a+c), with the predator being the focal species in the predator to prey similarity (x-axis), while the prey is the focal one in the prey to predator similarity (y-axis). One of the predators, Canis aureus, is not represented in the image because it is an extreme case (where all its range is suppressed by the absence of preys) and it would make the interpretation of the data more difficult.

