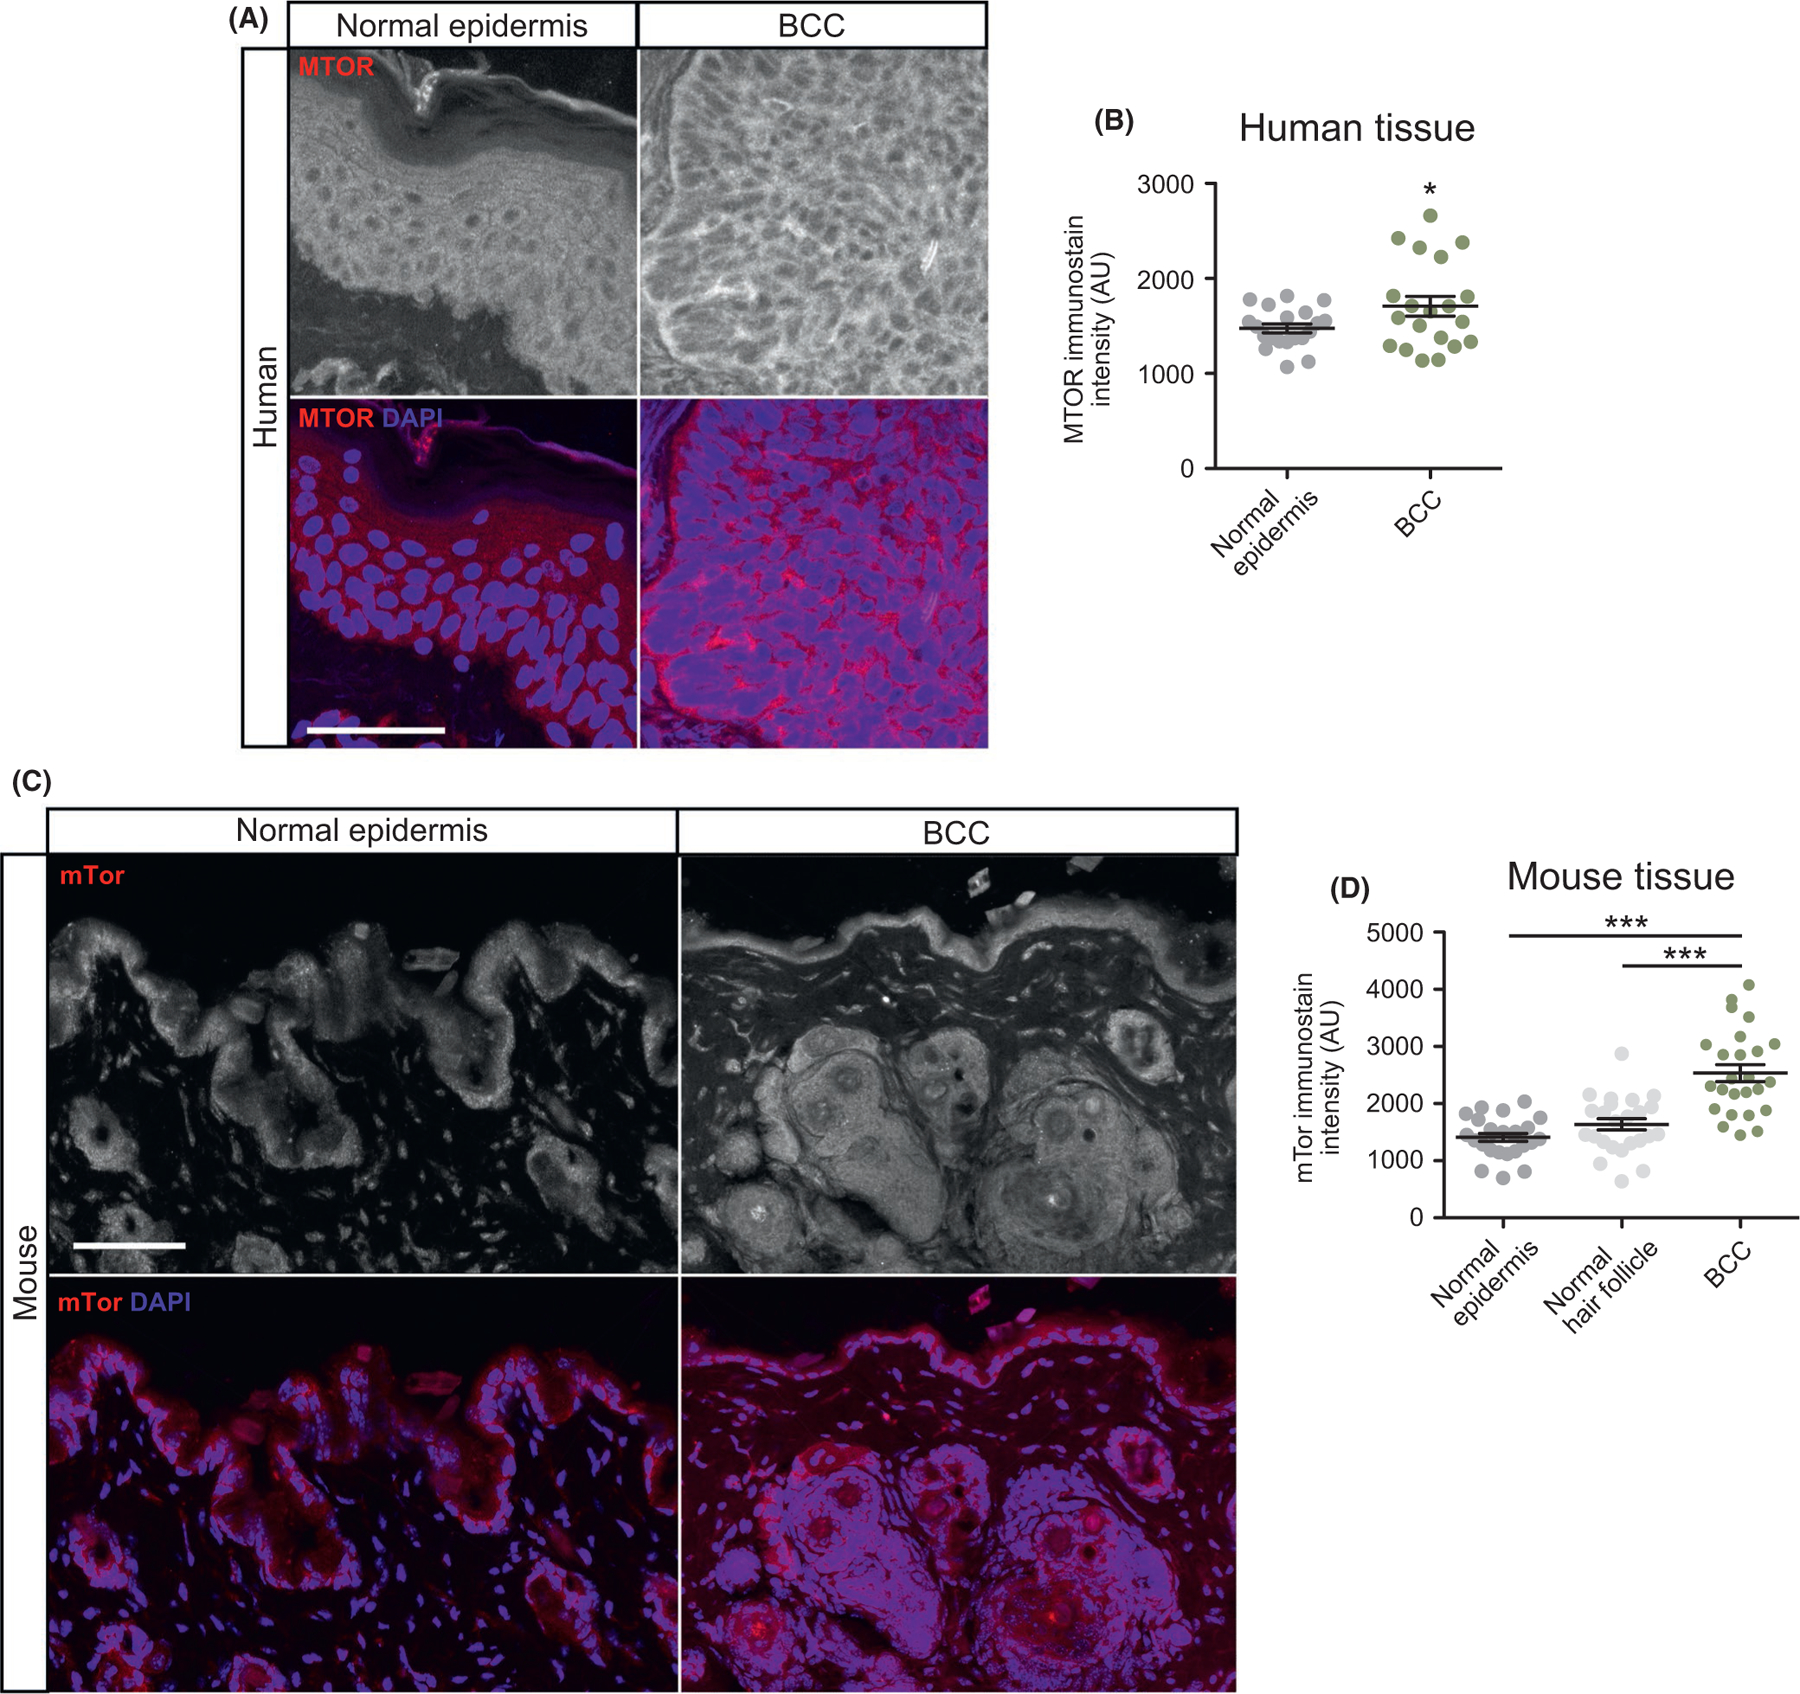
FIGURE 2.

MTOR is overexpressed in human and mouse BCC. A) Immunofluorescent staining of indicated markers in human normal epidermis and nodular BCC. Scale bar, 50 μm. B) Quantification of MTOR immunostain intensity (n = 5 different points of measurement from 4 individual samples). AU, arbitrary units. C) Immunofluorescent staining of indicated markers in normal epidermis, normal hair follicle or BCC derived from Ptch1 fl/fl; Gli1-CreERT2 mice. Scale bar, 50 μm. D) Quantification of mTor immunostain (n = 5 different points of measurement from 5 mice). Error bars represent SEM. Significance was determined by unpaired two-tailed t test. *p < 0.05; **p < 0.01; ***p < 0.001
