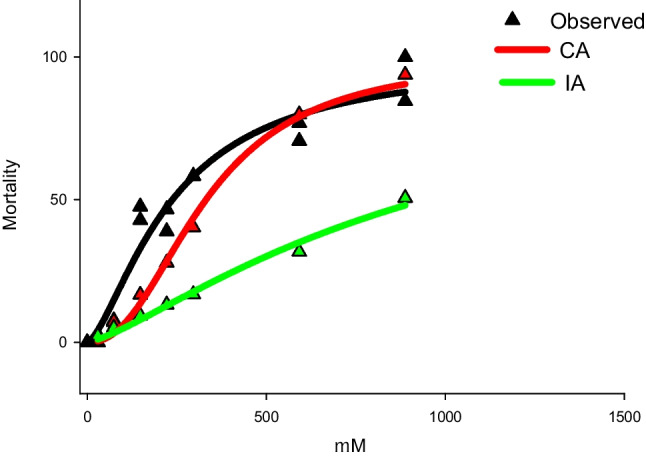
Fig. 2.

Joint toxicity of the 6 multicomponent mixture. Each point represents a single value. Black, red and green lines are, respectively, observed responses and predicted ones following the concentration addition (CA) and independent action (IA)

Joint toxicity of the 6 multicomponent mixture. Each point represents a single value. Black, red and green lines are, respectively, observed responses and predicted ones following the concentration addition (CA) and independent action (IA)