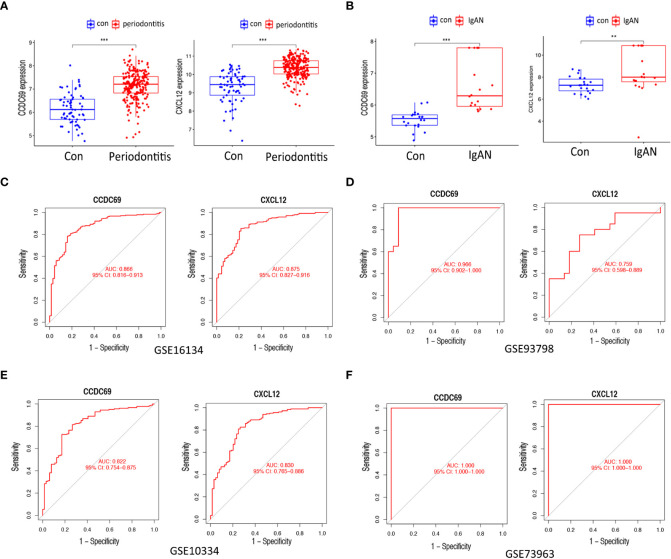
Figure 6.
Expression pattern validation and diagnostic value. (A) Expression of CXCL12 and CCDC69 in GSE16134. (B) Expression of CXCL12 and CCDC69 in GSE93798. (C) ROC curve of the shared diagnostic genes in GSE16134. (D) ROC curve of the shared diagnostic genes in GSE93798. (E) ROC curve of the shared diagnostic genes in GSE10334. (F) ROC curve of the shared diagnostic genes in GSE73953. Con: control; IgAN: IgA nephropathy. P < 0.05; ** P < 0.01; *** P < 0.001.

