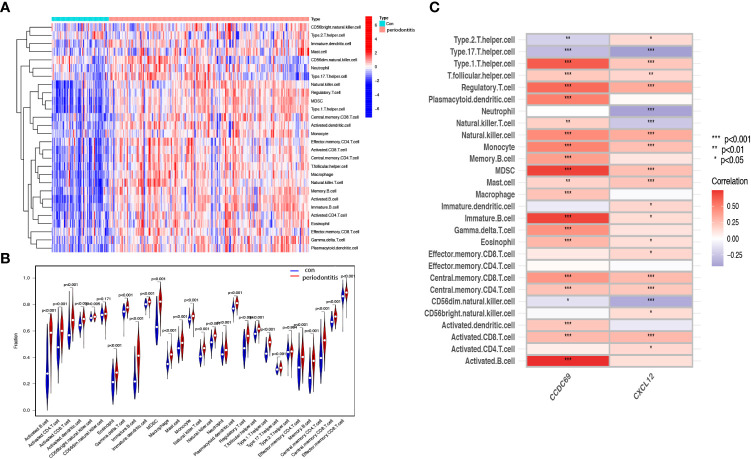
Figure 7.
Analysis of immune infiltration associated with periodontitis. Heat (A) and violin plot (B) showing the distribution of 28 immune cells in the GSE16134 sample. (C) The relationship between diagnostic genes and immune cell infiltration. Con, control.

