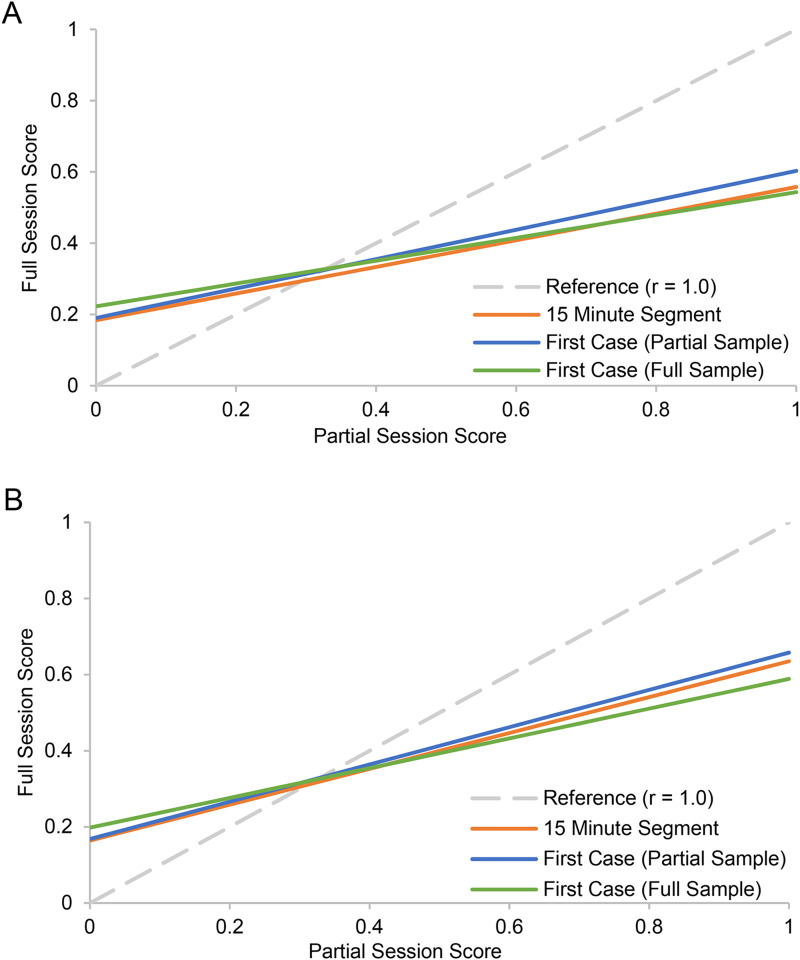
Figure 1.
Partial session score predicting full session score for adherence (AP and P).
Note. Panel A: Analytic Process Adherence. Panel B: Principles Adherence. The figure illustrates results across the two sets of analyses. The lines for 15-Minute Segment and First Case (Partial Sample) reflect the 15-min segment sample with N = 56 supervisors, and the line for First Case (Full Sample) reflects the full sample with a maximum of seven repeated measurements (N = 374) nested within supervisors (N = 57). The reference line represents a correlation of 1.0, that is, an identical conclusion about Adherence based on the full session score and partial session score. The models controlled for the proportion of the full session duration covered by the partial session observation, with the plotted values reflecting an average proportion.

