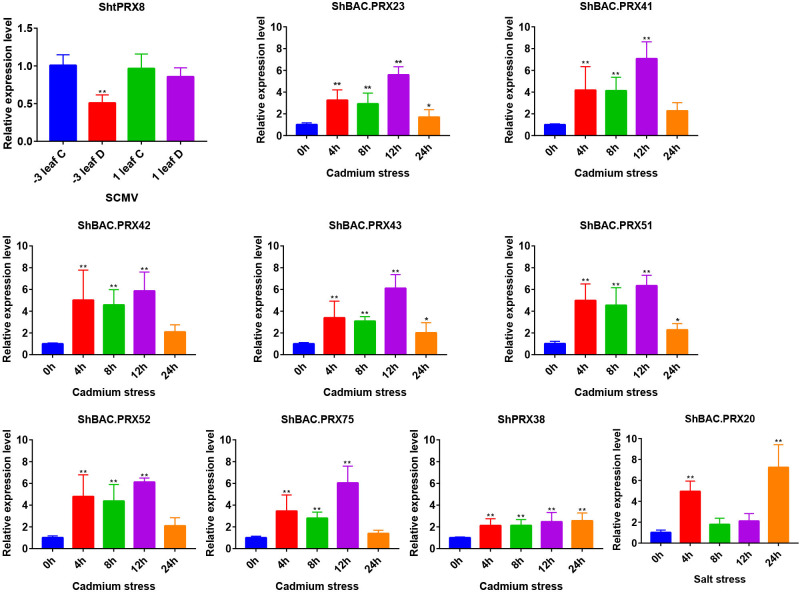
Figure 7.
Analysis of SCMV, Cd, and salt stress differentially expressed PRX gene family members in sugarcane. The black bar graphs represent the relative expression levels of PRX family genes in the leaves under SCMV, Cd, and salt stresses. The −3 leaf C, the −3 leaf of virus-free Badila; the 1 leaf C, the +1 leaf of virus-free Badila; −3 leaf D, the -3 leaf of post-SCMV infection Badila (symptomatic leaf); 1 leaf D, the +1 leaf of post-SCMV infection Badila (asymptomatic leaf); *: 0.01 < p < 0.05, **: p < 0.01; The mean and SD were calculated from three biological and three technical replicate samples.

