. 2021 Dec 1;3(1):66–81. doi: 10.1158/2643-3230.BCD-21-0095

Figure 3.

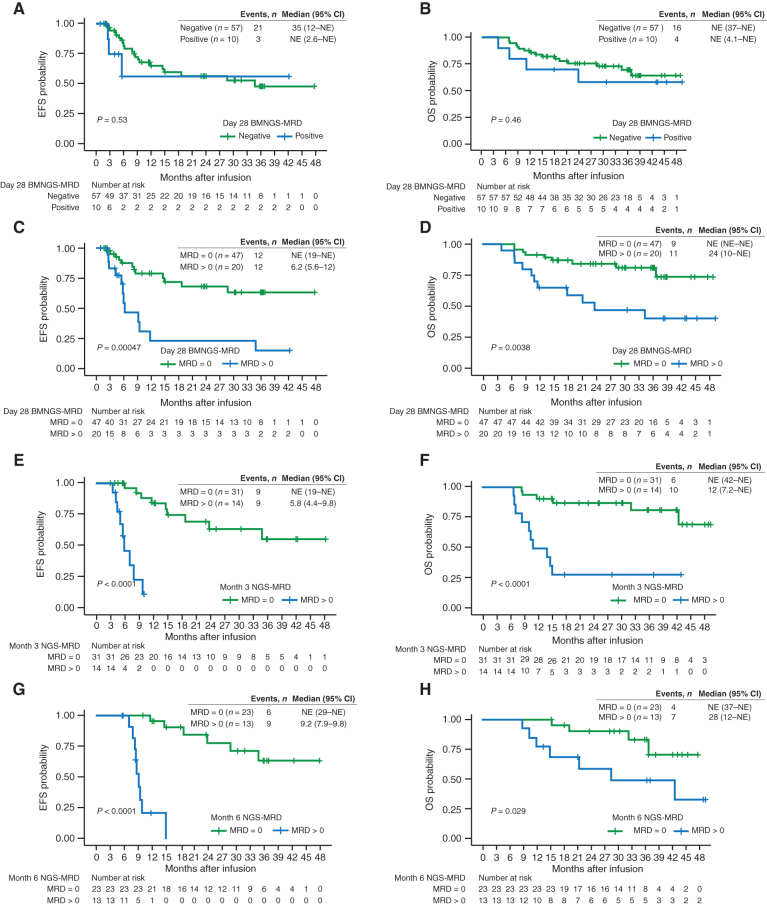
Figure 3. CR/CRi patients with detectable BMNGS-MRD at the end of day 28, month 3, and month 6 after tisagenlecleucel therapy had significantly shorter EFS and OS by Kaplan–Meier analyses, with the log-rank test P values included. EFS (A) and OS (B) of responding patients with BMNGS-MRD− based on cutoff of 10−6 at day 28 (green line) versus those with BMNGS-MRD+ (blue lines). EFS (C) and OS (D) of responding patients based on detection of BMNGS-MRD at 28 days at any level (blue lines) compared with patients with BMNGS-MRD = 0 (green lines). EFS (E) and OS (F) of responding patients based on detection of NGS-MRD at 3 months at any level (blue lines) compared with patients with BMNGS-MRD = 0 (green lines). EFS (G) and OS (H) of responding patients based on detection of BMNGS-MRD at 6 months at any level (blue lines) compared with patients with BMNGS-MRD = 0 (green lines). CI, confidence interval; NE, not estimable.

CR/CRi patients with detectable BMNGS-MRD at the end of day 28, month 3, and month 6 after tisagenlecleucel therapy had significantly shorter EFS and OS by Kaplan–Meier analyses, with the log-rank test P values included. EFS (A) and OS (B) of responding patients with BMNGS-MRD− based on cutoff of 10−6 at day 28 (green line) versus those with BMNGS-MRD+ (blue lines). EFS (C) and OS (D) of responding patients based on detection of BMNGS-MRD at 28 days at any level (blue lines) compared with patients with BMNGS-MRD = 0 (green lines). EFS (E) and OS (F) of responding patients based on detection of NGS-MRD at 3 months at any level (blue lines) compared with patients with BMNGS-MRD = 0 (green lines). EFS (G) and OS (H) of responding patients based on detection of BMNGS-MRD at 6 months at any level (blue lines) compared with patients with BMNGS-MRD = 0 (green lines). CI, confidence interval; NE, not estimable.