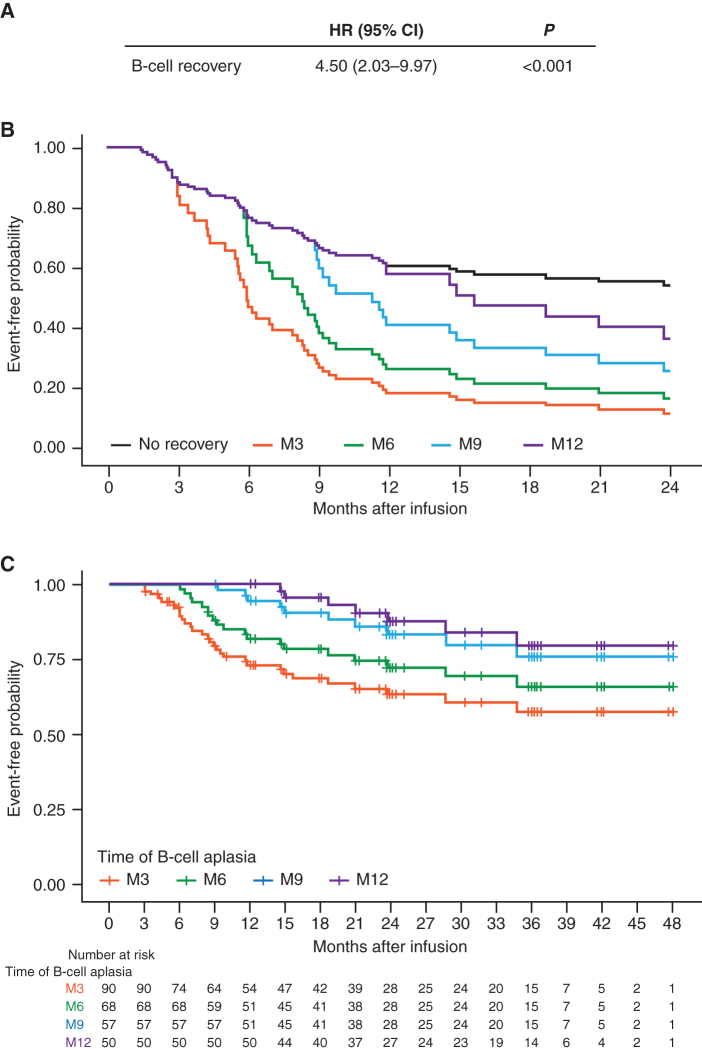
Figure 4.
Univariate Cox model to assess the time-dependent effect of B-cell recovery on EFS. A, HR, confidence interval, and P value for the risk of relapse once patients had B-cell recovery within 1 year after infusion. B, Adjusted EFS curves based on the Cox model from A for patients with B-cell recovery by month 3 (M3), month 6 (M6), month 9 (M9), and month 12 (M12). C, Landmark EFS analysis for patients with persistent B-cell aplasia and reaching M3, M6, M9, and M12.

