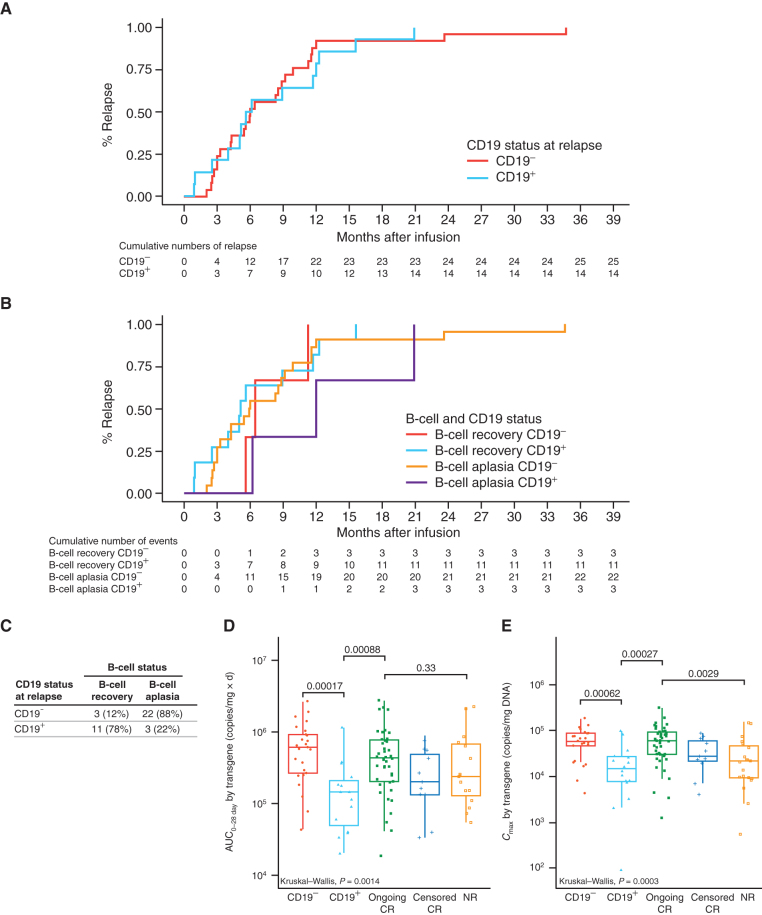
Figure 6.
Comparison of time to relapse, B-cell recovery incidence, and tisagenlecleucel expansion in CD19− and CD19+ relapse patients. A, Kaplan–Meier (KM) analysis for time to relapse by CD19 status: CD19- (red) and CD19+ (aqua). B, KM analysis for cumulative incidence of relapse by B-cell recovery and CD19 status: B-cell recovery plus CD19- (red), B-cell recovery plus CD19+ (green), B-cell aplasia plus CD19- (aqua), and B-cell aplasia plus CD19+ (purple). C, Relapses according to CD19 status and the presence or absence of B-cell recovery. AUC0–28d (D) and Cmax (E) of transgene levels in patients with CD19- relapse, CD19+ relapse, ongoing CR more than 1 year, CR censored for other therapy or HCT within the first year, and nonresponders (NR). Kruskal–Wallis P values indicate the significance difference in mean levels among different groups. Numbers above the brackets are pairwise comparison P values.

