. 2021 Aug 24;3(1):32–49. doi: 10.1158/2643-3230.BCD-21-0050

Figure 4.

Figure 4. Use of interpatient data integration to identify a relapse-enriched leukemia cell (RELC) expression signature in multiple patients. A, UMAP representation of scRNA-seq data from all AML samples colored by inferred cell lineage, with the differentiated (“monocytic”) and undifferentiated (“HSC-like”) subpopulations indicated. B, Mutation-containing cells colored according to sample of origin. C, Cells colored according to time point (blue, presentation; red, relapse). D, Cells colored according to graph-based cluster assignment, with the relapse enriched cluster, “cluster 0,” indicated. E, Proportion of each sample in cluster 0 (blue, presentation; red, relapse). F, Each sample plotted individually. G, Selected modules that exhibit heterogeneous expression. Top row, representative modules that are more highly expressed in differentiated cells. Bottom row, modules that are more highly expressed in relapse-enriched cluster 0. *S100 indicates that multiple S100 genes were present. H, Functional enrichment, calculated and plotted using the clusterProfiler R package, of genes downregulated (log2 fold change ≤ –1.5) in cluster 0 compared with other HSC-rich clusters. I, RELC proportions in presentation and relapse samples from an independent cohort analyzed using bulk RNA-seq. Left, postchemotherapy cases; right, postallogeneic transplant cases. RELC proportions were inferred using CIBERSORTx (see Methods). act., activation; BASO, basophil; DEND, dendritic cell; D.S., double-strand; EOS, eosinophil; ERY, erythrocyte; fact. factor; GMP, granulocyte–monocyte progenitor; GRAN, granulocyte; imm., immune; LSC, leukemic stem cell; MEGA, megakaryocyte; MEP, megakaryocyte–erythroid progenitor; MONO, monocyte; Neut., neutrophil; NKT, natural killer T cell; P, presentation; R, relapse; Reg., regulation; rep., replication; UPN, unique patient number.

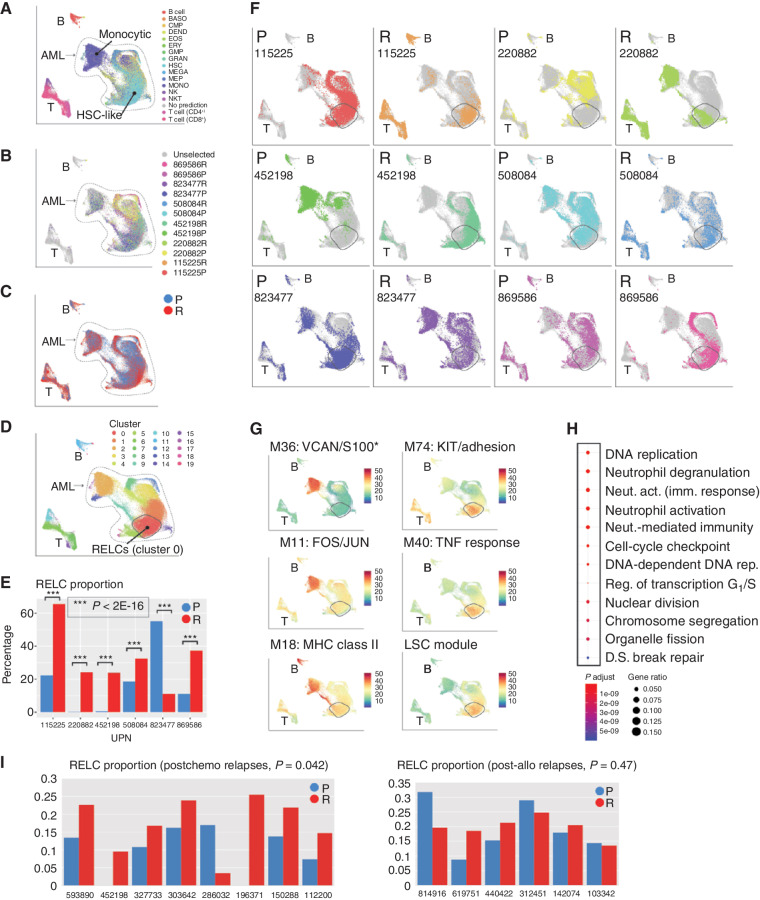
Use of interpatient data integration to identify a relapse-enriched leukemia cell (RELC) expression signature in multiple patients. A, UMAP representation of scRNA-seq data from all AML samples colored by inferred cell lineage, with the differentiated (“monocytic”) and undifferentiated (“HSC-like”) subpopulations indicated. B, Mutation-containing cells colored according to sample of origin. C, Cells colored according to time point (blue, presentation; red, relapse). D, Cells colored according to graph-based cluster assignment, with the relapse enriched cluster, “cluster 0,” indicated. E, Proportion of each sample in cluster 0 (blue, presentation; red, relapse). F, Each sample plotted individually. G, Selected modules that exhibit heterogeneous expression. Top row, representative modules that are more highly expressed in differentiated cells. Bottom row, modules that are more highly expressed in relapse-enriched cluster 0. *S100 indicates that multiple S100 genes were present. H, Functional enrichment, calculated and plotted using the clusterProfiler R package, of genes downregulated (log2 fold change ≤ –1.5) in cluster 0 compared with other HSC-rich clusters. I, RELC proportions in presentation and relapse samples from an independent cohort analyzed using bulk RNA-seq. Left, postchemotherapy cases; right, postallogeneic transplant cases. RELC proportions were inferred using CIBERSORTx (see Methods). act., activation; BASO, basophil; DEND, dendritic cell; D.S., double-strand; EOS, eosinophil; ERY, erythrocyte; fact. factor; GMP, granulocyte–monocyte progenitor; GRAN, granulocyte; imm., immune; LSC, leukemic stem cell; MEGA, megakaryocyte; MEP, megakaryocyte–erythroid progenitor; MONO, monocyte; Neut., neutrophil; NKT, natural killer T cell; P, presentation; R, relapse; Reg., regulation; rep., replication; UPN, unique patient number.