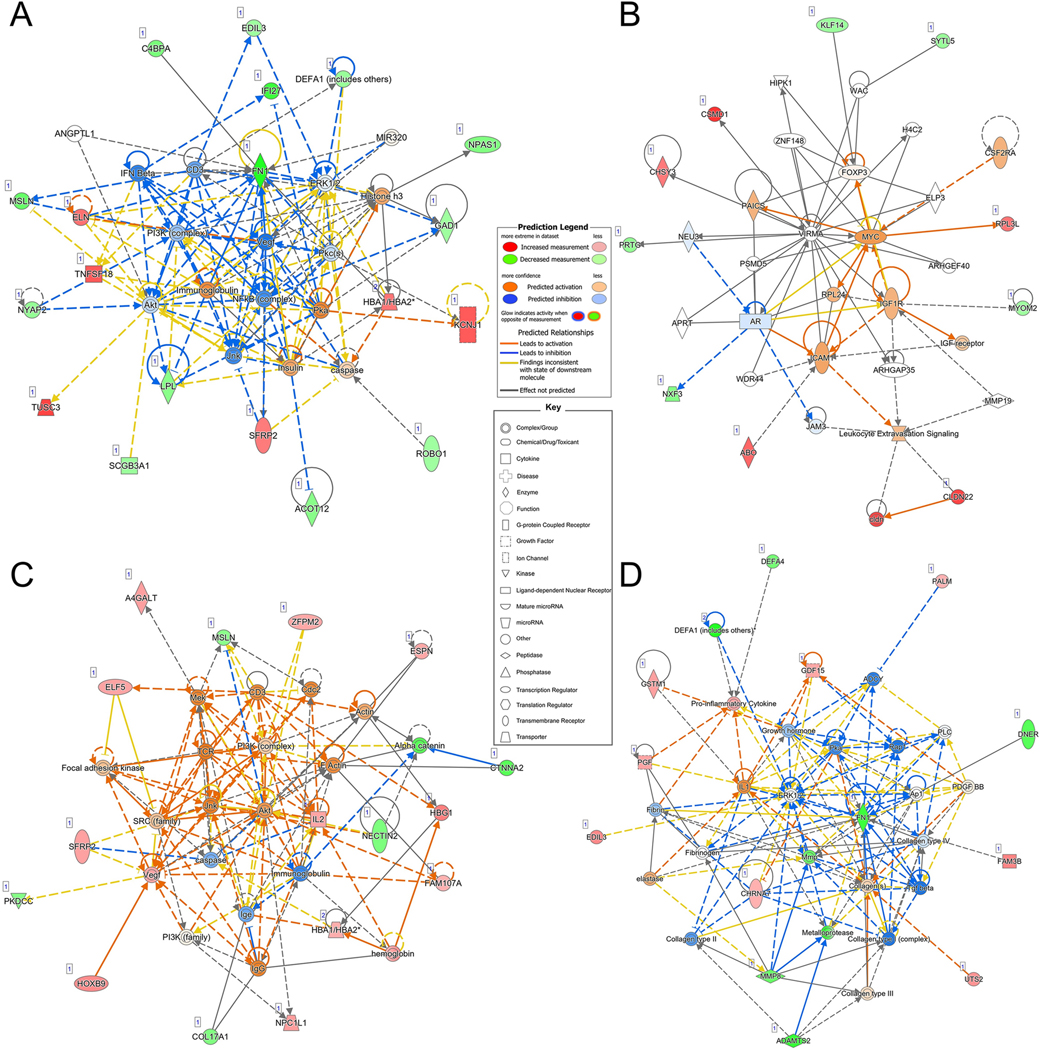
Figure 3: Ingenuity Pathway Analysis Results.
Networks derived from Ingenuity Pathway Analysis based on differentially expressed genes associated with risk as stratified by aneurysm size or PHASES score. For input differentially expressed genes, red indicates increased expression in high-risk aneurysm cases, while green denotes decreased expression; the color intensity reflects fold-change. Non-differentially expressed genes with known interactions are not colored. Direct and indirect relationships are shown by solid and dashed lines, respectively. There were 2 significant networks associated with the differentially expressed genes identified using aneurysm size as a risk metric. A). The first network, p-score of 50, reflected embryonic development, organismal development, tissue development and had a main node at NFKB. B). The second network had a score of 22 and its top diseases and functions were organ development, tissue development, and tissue morphology. C). The most significant network created using DEGs identified when assessing risk by PHASES score had a pscore of 34 and reflected connective tissue disorders, organismal development, and organismal injury and abnormalities. D). The second network with a score of 29 was associated with cellular movement, hematological system development and function, and immune cell trafficking. Abbreviations: PHASES=Population, Hypertension, Age, Size, Earlier subarachnoid hemorrhage, Site

