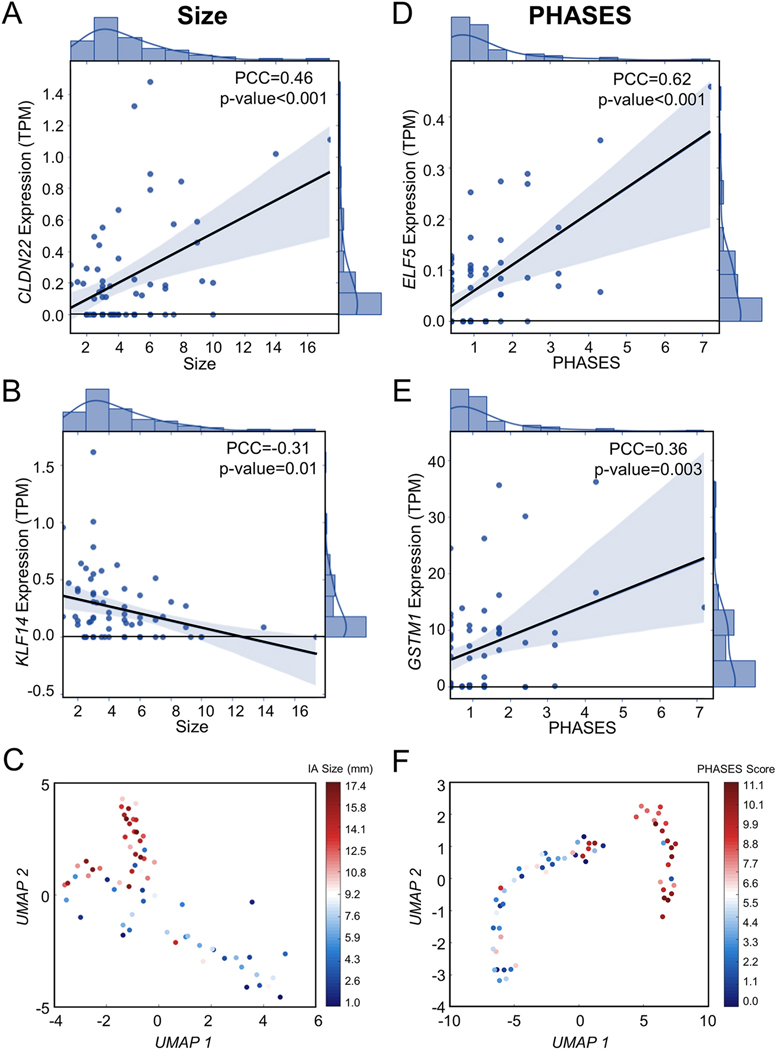
Figure 4: Correlation of Differentially Expressed Genes with IA Risk.
Two genes were significantly correlated with IA size (PCC>0.3, p-value<0.05). A). CLDN22 had a moderate, positive correlation (PCC=0.46) while (B) KLF14 had a weak, negative correlation (PCC=−0.31). Per these criteria, expression levels of 9 genes were correlated with PHASES score. The top 2 most significant are shown here (see Supplemental Figure 2 for correlation plots of the remaining genes). C). ELF5 had a strong, positive correlation with a PCC of 0.62. D). GSTM1 had a weak, positive correlation (PCC=0.36). Abbreviations: PCC=Pearson correlation coefficient, TPM=transcripts per million, PHASES=Population, Hypertension, Age, Size, Earlier subarachnoid hemorrhage, Site

