Fig. 2.

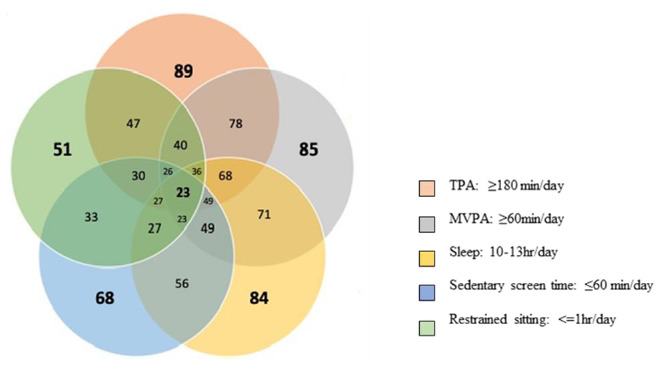
Venn diagram illustrating the proportion of children meeting all of the WHO 24-hour movement guidelines, meeting the guidelines individually and meeting combinations of the guidelines (n=71)

Venn diagram illustrating the proportion of children meeting all of the WHO 24-hour movement guidelines, meeting the guidelines individually and meeting combinations of the guidelines (n=71)