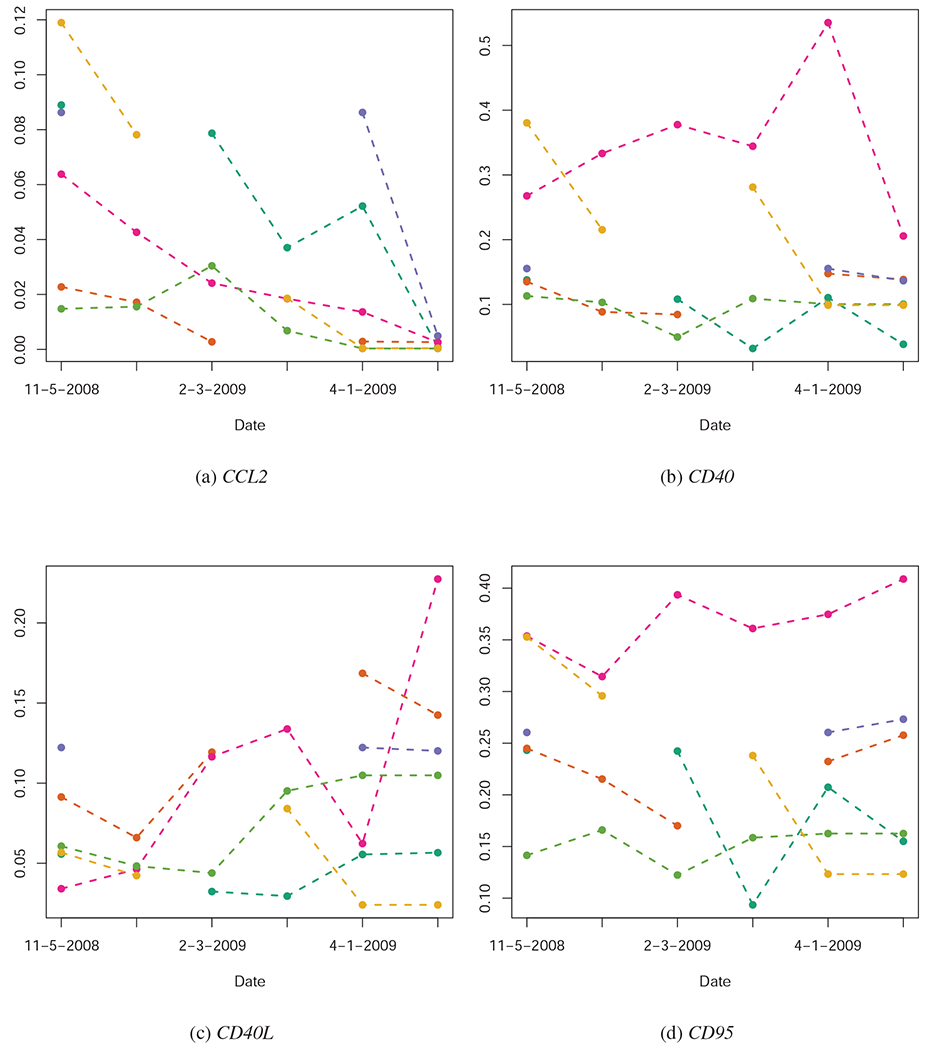
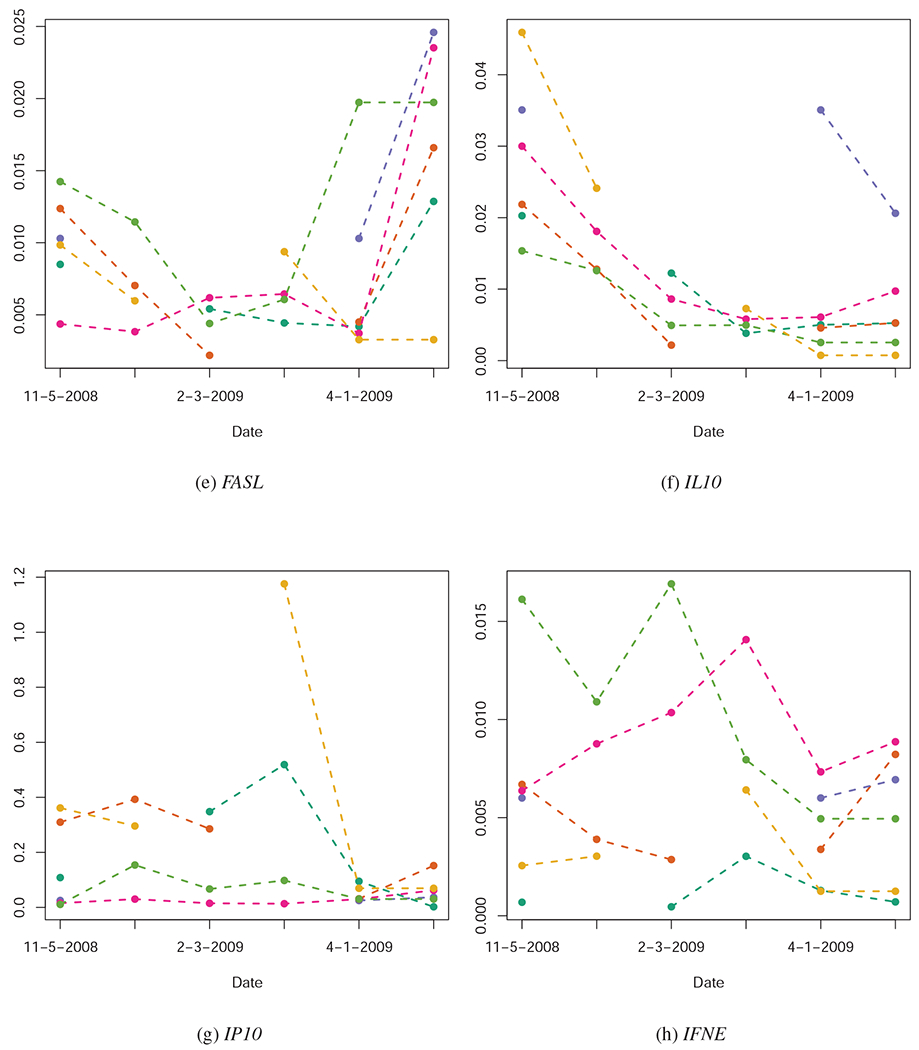
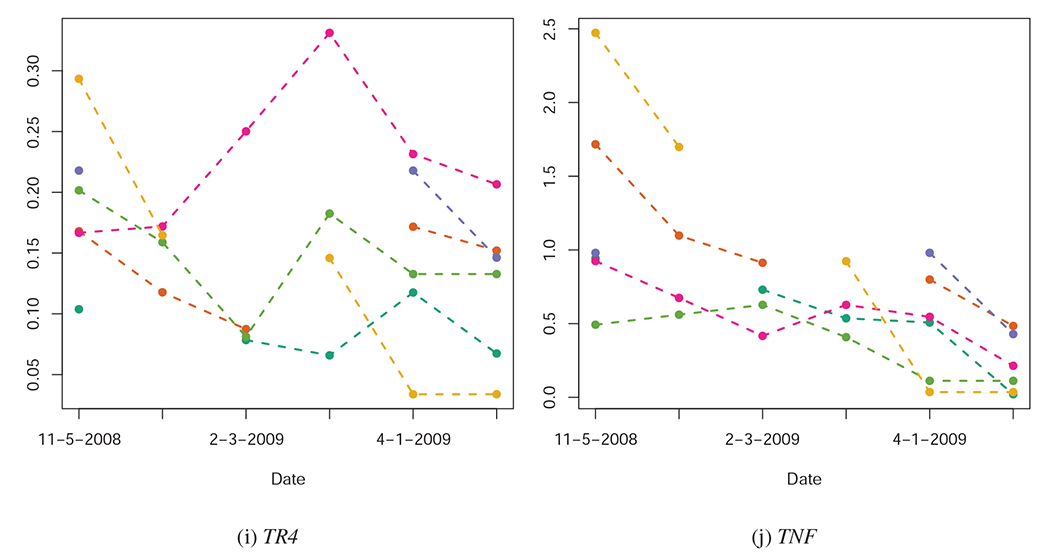
Figure 1:


Quantified expression levels (Y-axis) of several of the genes investigated in this study, pre-infection (11-05-2008), at several dates post-infection (01-05-2009, 02-03-2009, 03-02-2009, 04-01-2009), and at time of euthanasia. Each animal’s gene expression over time is represented by a unique color. Quantification could not be completed for all animals at all dates, leading to some cases of missing data. Across these sub-figures, we note that some genes (e.g. TNF) show consistent temporal trends across animals; other genes, however, show no overall temporal pattern in expression, even though their expression levels may be indicative of the severity TB infection (See Figure 2).
