
Figure 2:
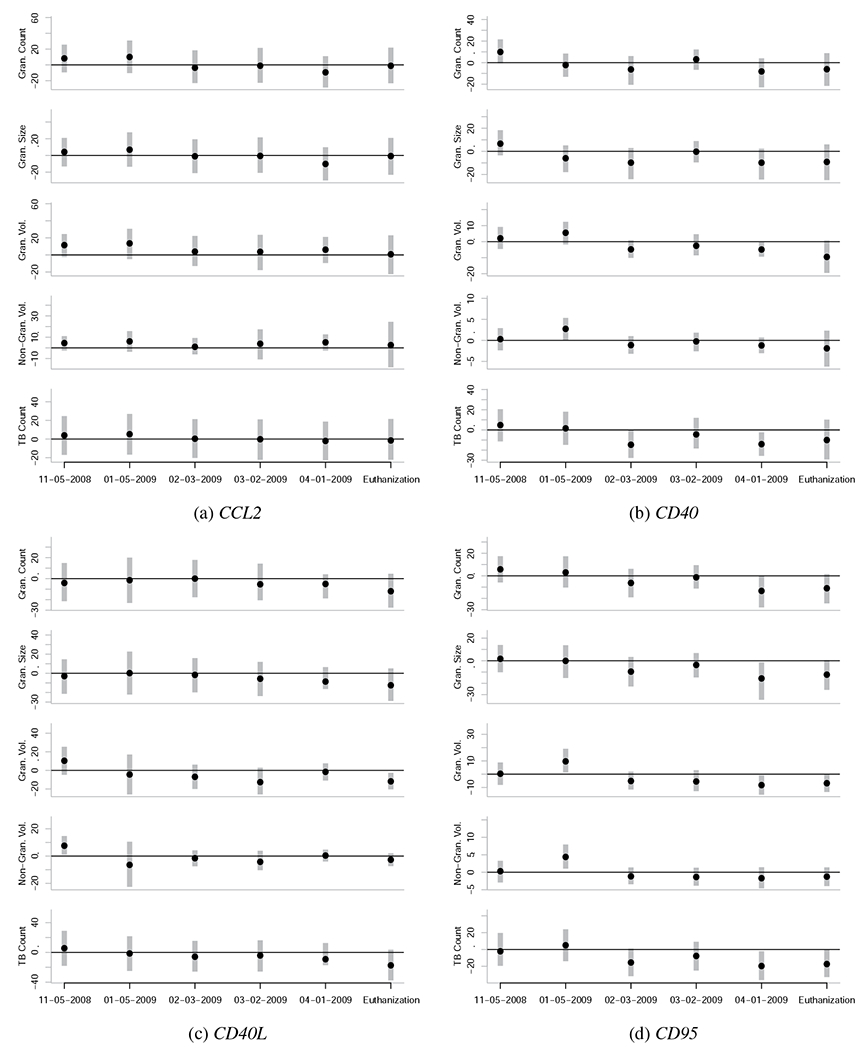
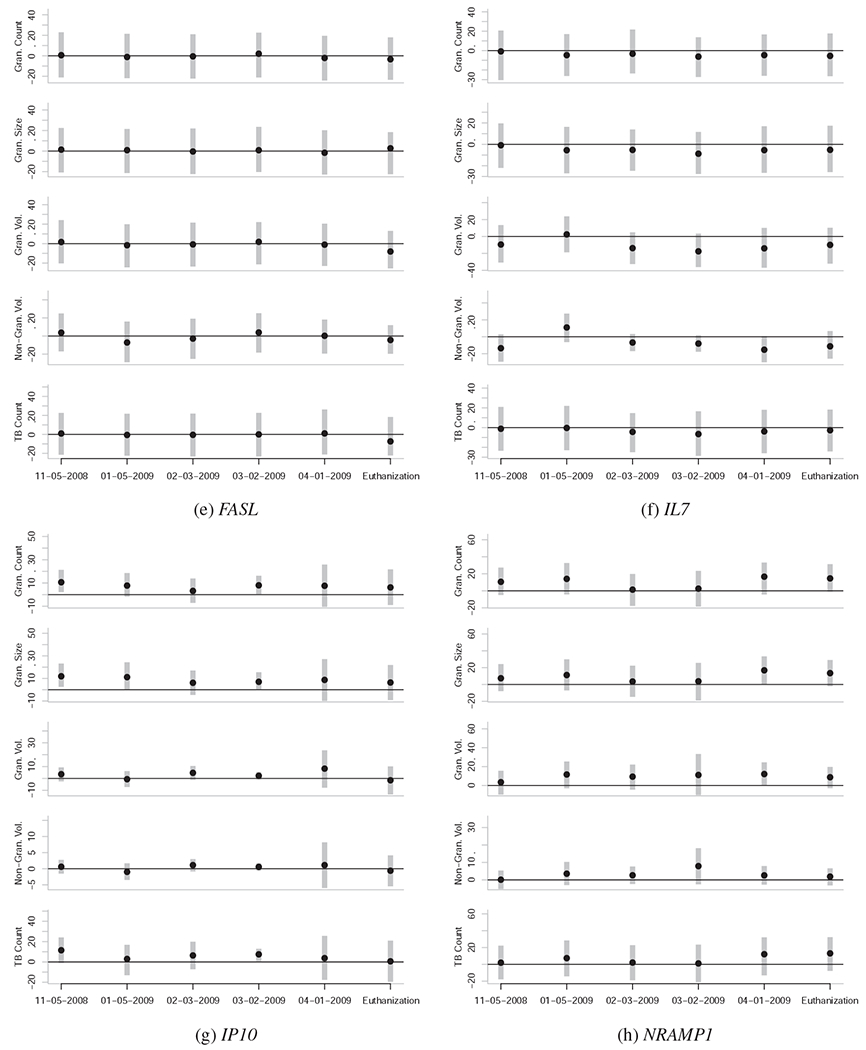
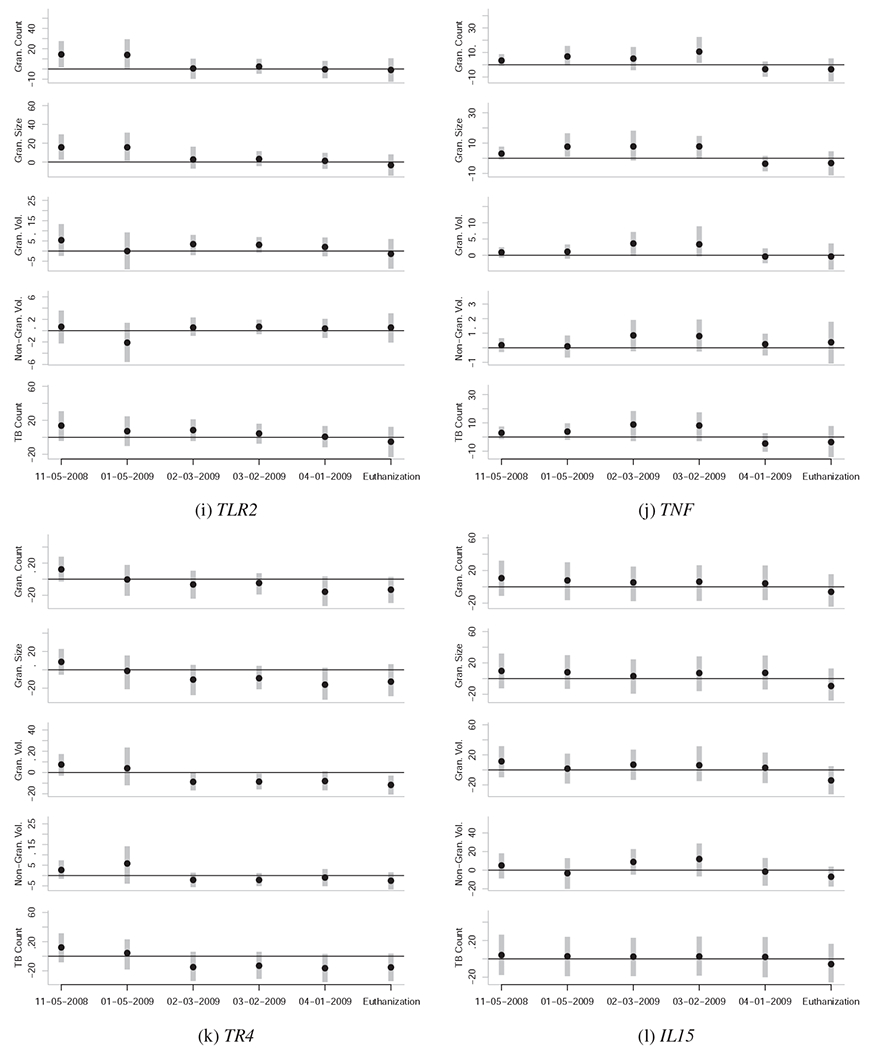
Caterpillar plots representing the associations between gene expression levels at various dates and quantitative measures of TB severity at euthanasia. Each subfigure is unique to a given gene, and each subplot within each subfigure is unique to a given quantitative measure of TB severity at euthanasia (vertical axis) for a given date of gene expression quantification (horizontal axis). The black points represent the posterior mean and the vertical grey bars indicate the central 95% posterior credibility intervals. The horizontal black lines represent the value of zero, or no effect. Null effects are typically close to zero, with confidence intervals that overlap zero. Reliable effects have confidence intervals that don’t overlap zero, or do so only slightly. To be confident that an effect is actually non-zero, it is also useful to see if the effect is observed across the majority of the five outcome variables, and if the effect is part of a temporal trend.