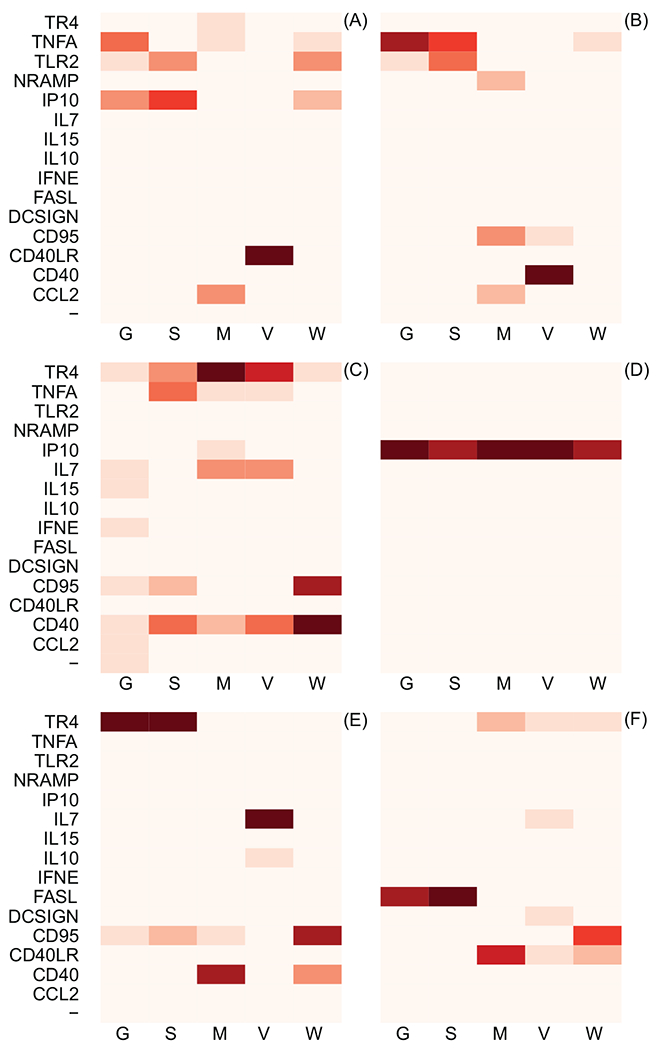
Figure 3:

Results of formal model comparison using WAIC. Each block represents a date when gene expression levels were quantified: A) 11/05/2008, B) 01/05/2009, C) 02/03/2009, D) 03/02/2009, E) 04/01/2009, F) Time of euthanasia. Each vertical column illustrates the information theoretic support that the specified gene (on the vertical axis) is the gene whose expression levels best predict a proxy of TB severity (on the horizontal axis). The column labels: G, S, M, V, and W, correspond to granuloma count in sections of lung, max granuloma size, granulomatous lesion volume, non-granulomatous lesion volume, and TB cell count, respectively. Increasing intensity of the red color indicates increasing information theoretic support. The quantitative results of the information theoretic model comparison used to generate this figure are included as Supplementary Materials. The “-” symbol indicates the performance of the null model, which does not include gene expression levels as a predictor; it should be noted that the null model has almost no information theoretic support in any of the model comparisons, meaning that use of gene expression levels to predict TB severity almost universally improves predictive inference. Consistent support for a given gene across proxies for TB severity and time periods provides good evidence that there exists a relationship between TB pathogensis and gene expression levels.
