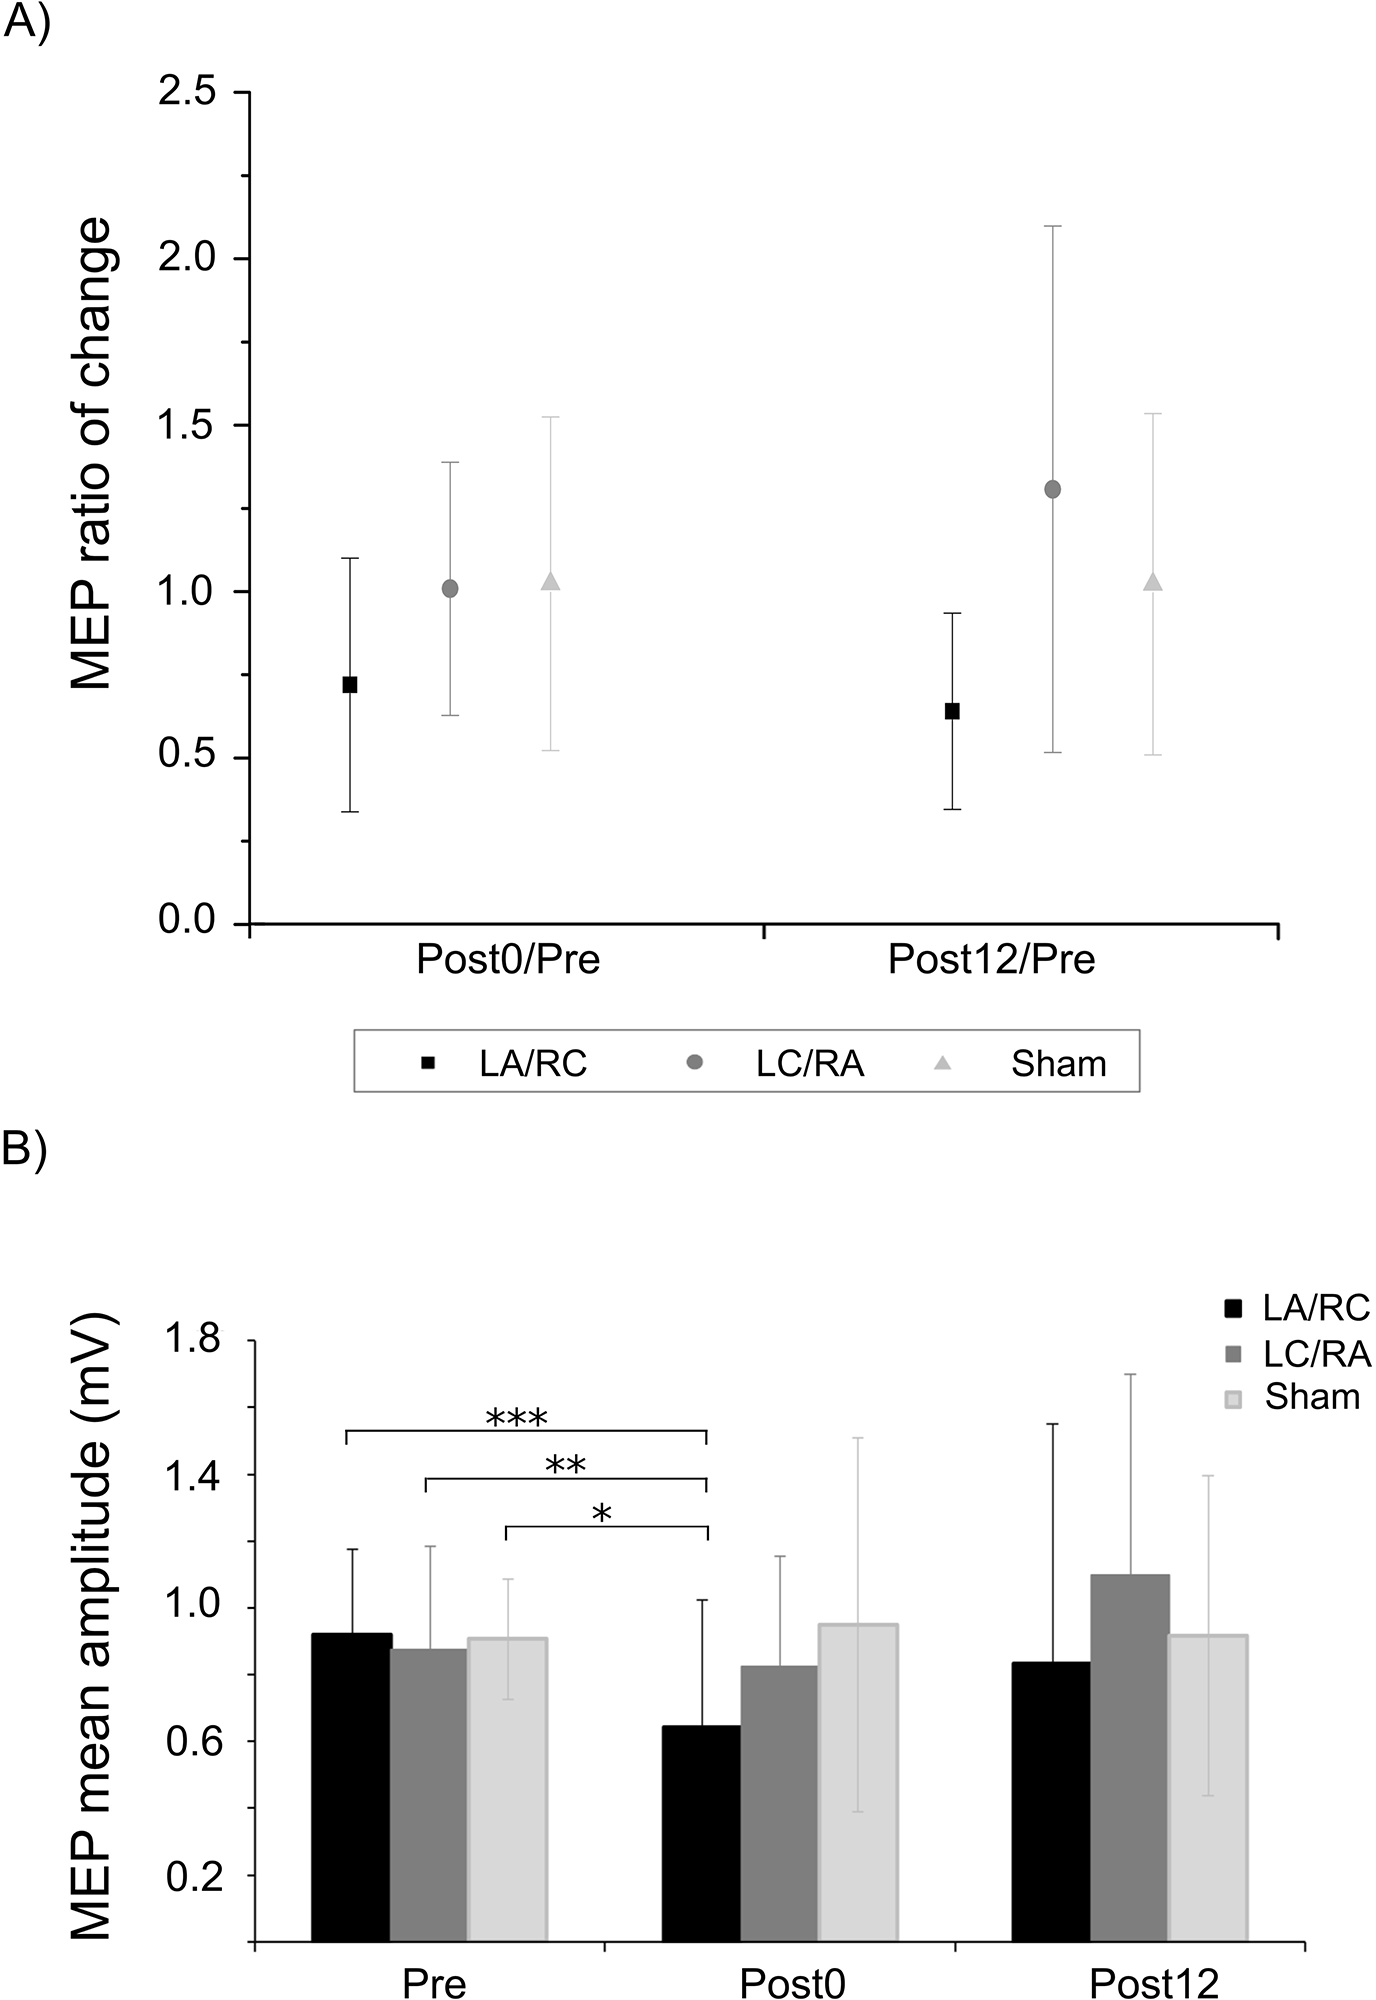
Figure 3. Effects of M1-M1 tDCS on MEPs.

A) Shows average change ratio (± SD) at the two time-points following the three M1-M1 tDCS conditions. No modulation is observed for both active M1-M1 conditions when compared to sham. B) Shows average raw MEP amplitudes (± SD) at the three time points. A significant reduction of MEP amplitude is observed at Post0 following the LA/RC condition when compared to all baseline values. Note that the analysis was conducted on non-averaged MEPs. *** p < .001; ** p < .01; * p < .05
