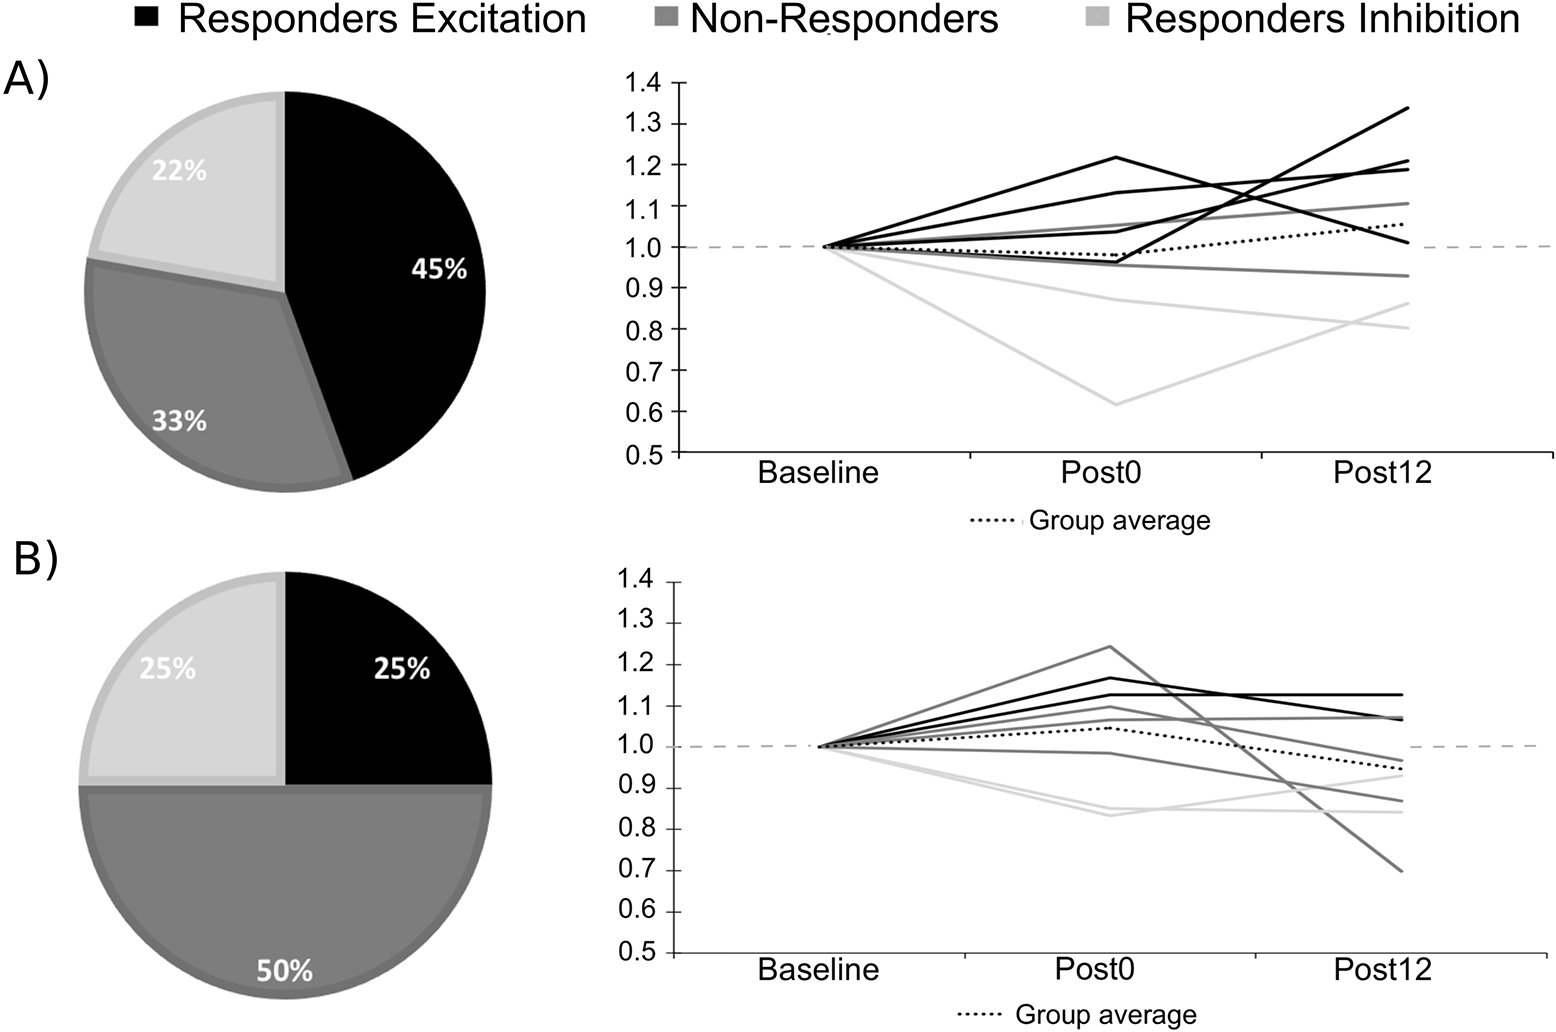
Figure 7. Individual change in GABA concentrations and response rate following the two active tDCS conditions.

Shows the response rate for the three clusters and the individual GABA ratios of change for A) LA/RC; B) LC/RA. Note that the doted grey line indicates a ratio of 1.00 (no change).
