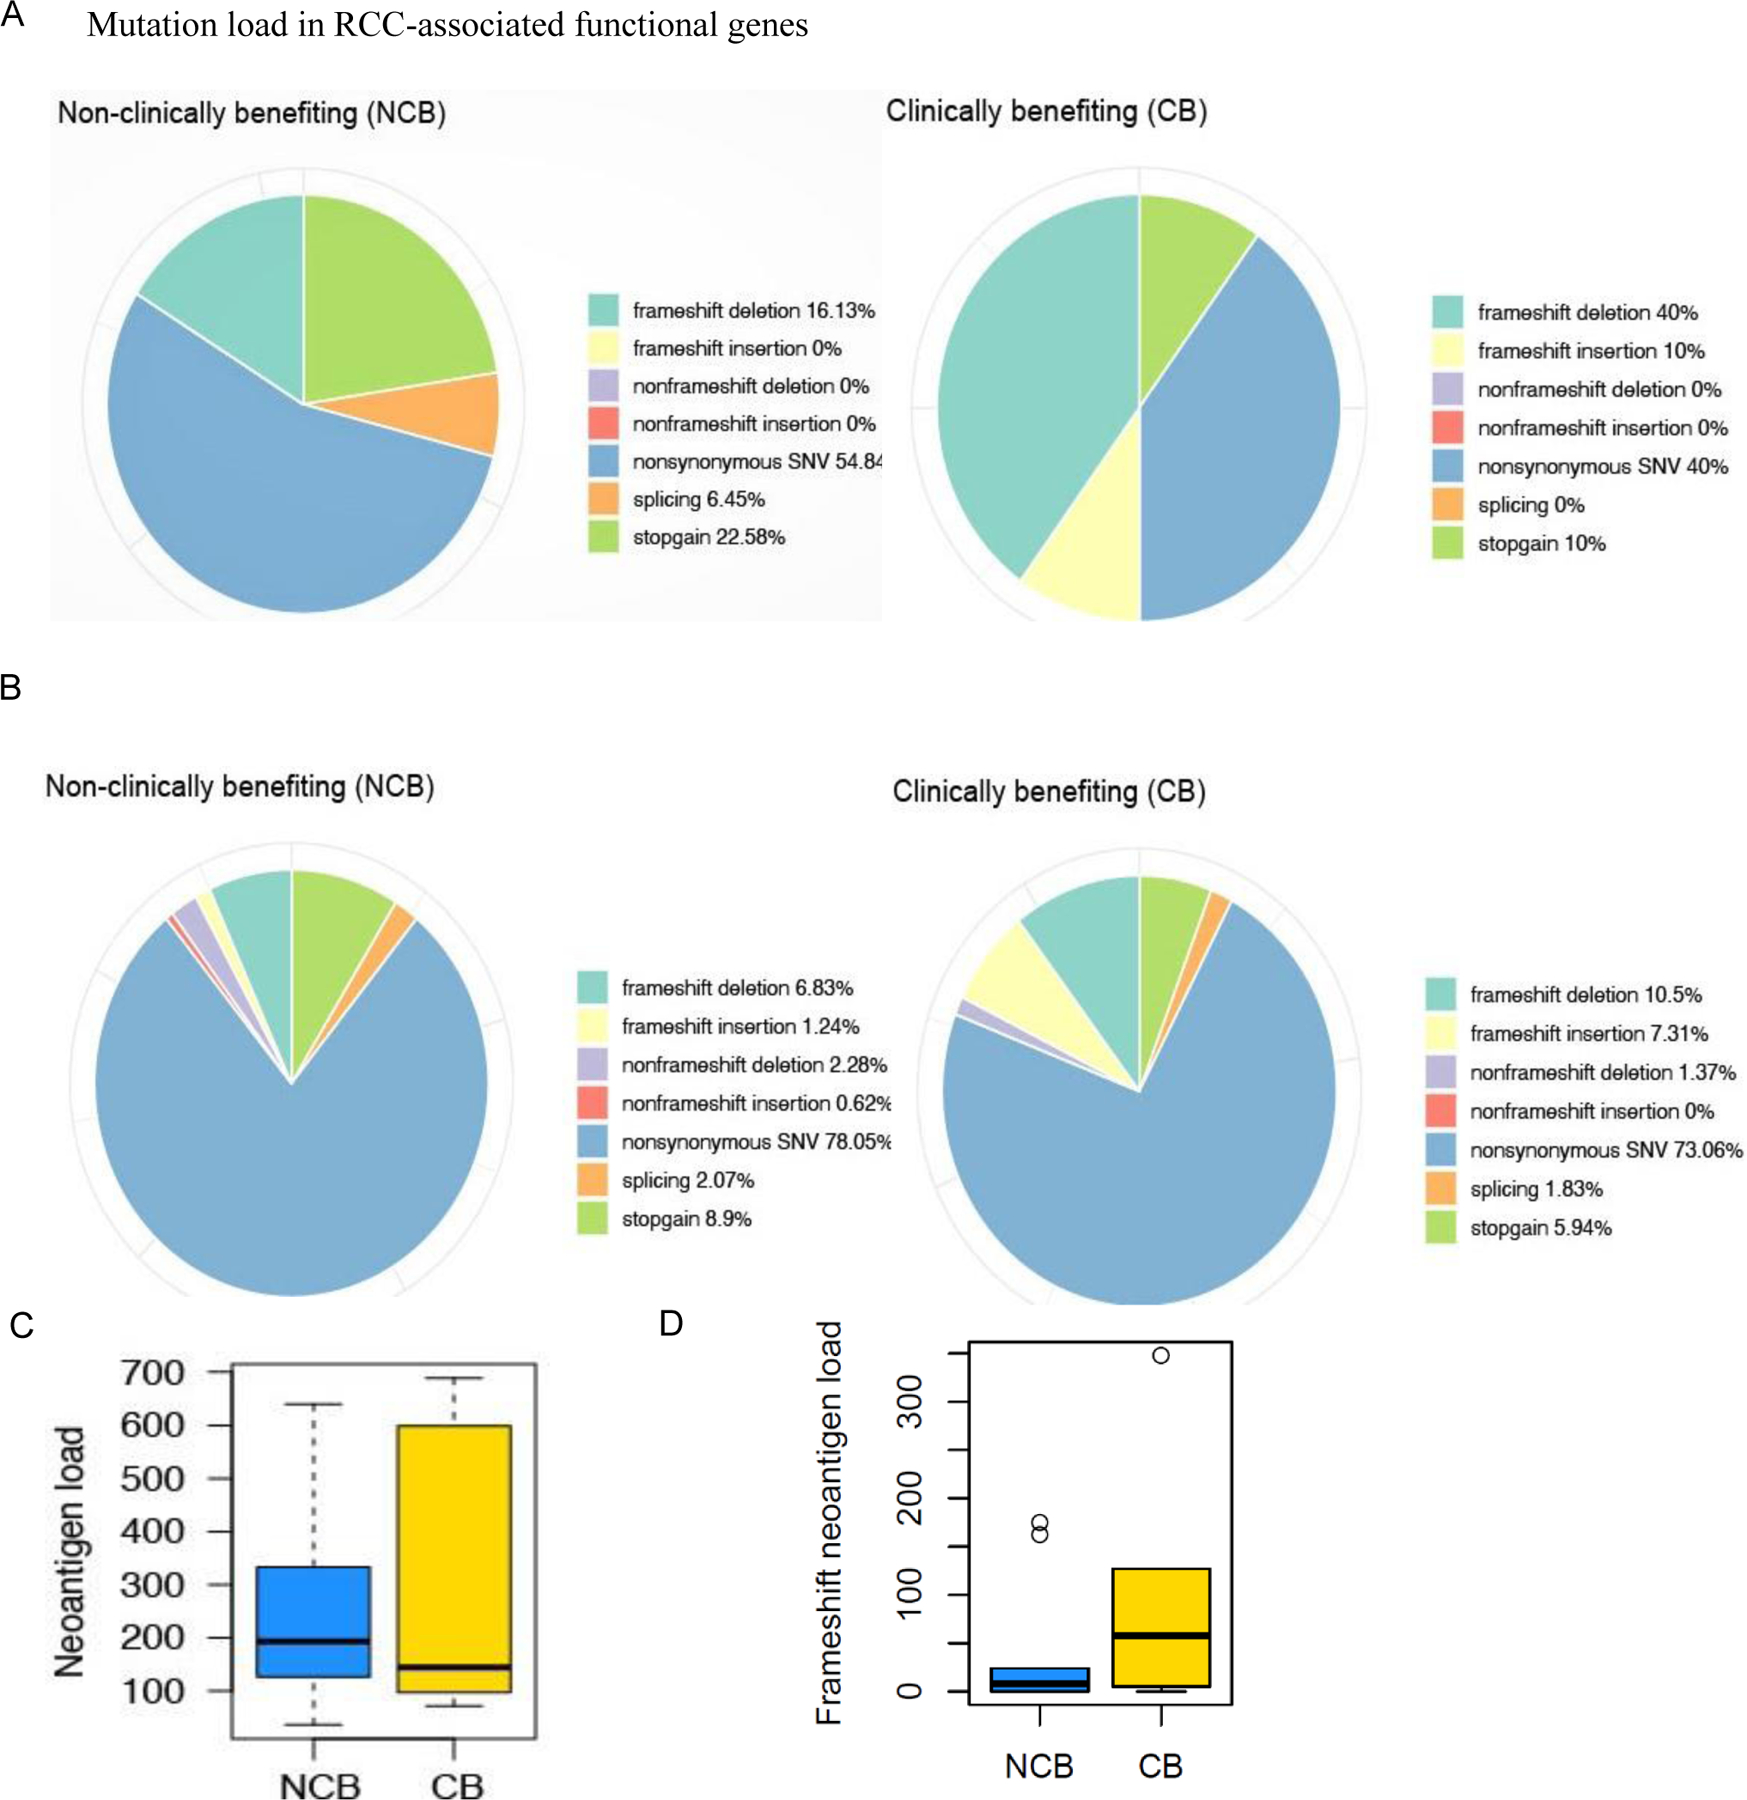
Fig. 2. Next generation sequencing analysis (NGS) of tumor tissue in clinically benefiting (CB) vs. non-clinically benefiting (NCB) patients.

(A-B) Pie charts showing the distribution of mutation load in CB vs. NCB patients enrolled in the SAbR and high-dose IL-2 trial: (A) different mutations in RCC associated functional genes and (B) genome-wide mutation load in RCC. Mutations including single-nucleotide variants (SNVs) were called by the Quantitative Biomedical Research Center (QBRC) mutation calling pipeline (Supplementary Materials and Methods) from whole exome sequencing data. The sequencing libraries from CB and NCB patients were generated from the DNA samples derived from formalin-fixed paraffin-embedded (FFPE) tissue blocks collected as a baseline. (C) Total predicted neoantigen load for patients enrolled in the SAbR + IL-2 trial comparing CB and NCB patients. Bold lines represent median neoantigen count. No difference in the predicted neoantigen load was identified between CB and NCB patients (p = 0.569). (D) Total frameshift neoantigen load for patients enrolled in the SAbR + IL-2 trial comparing CB and NCB patients. No difference in the predicted frameshift neoantigen load was identified between CB and NCB patients (p = 0.39).
