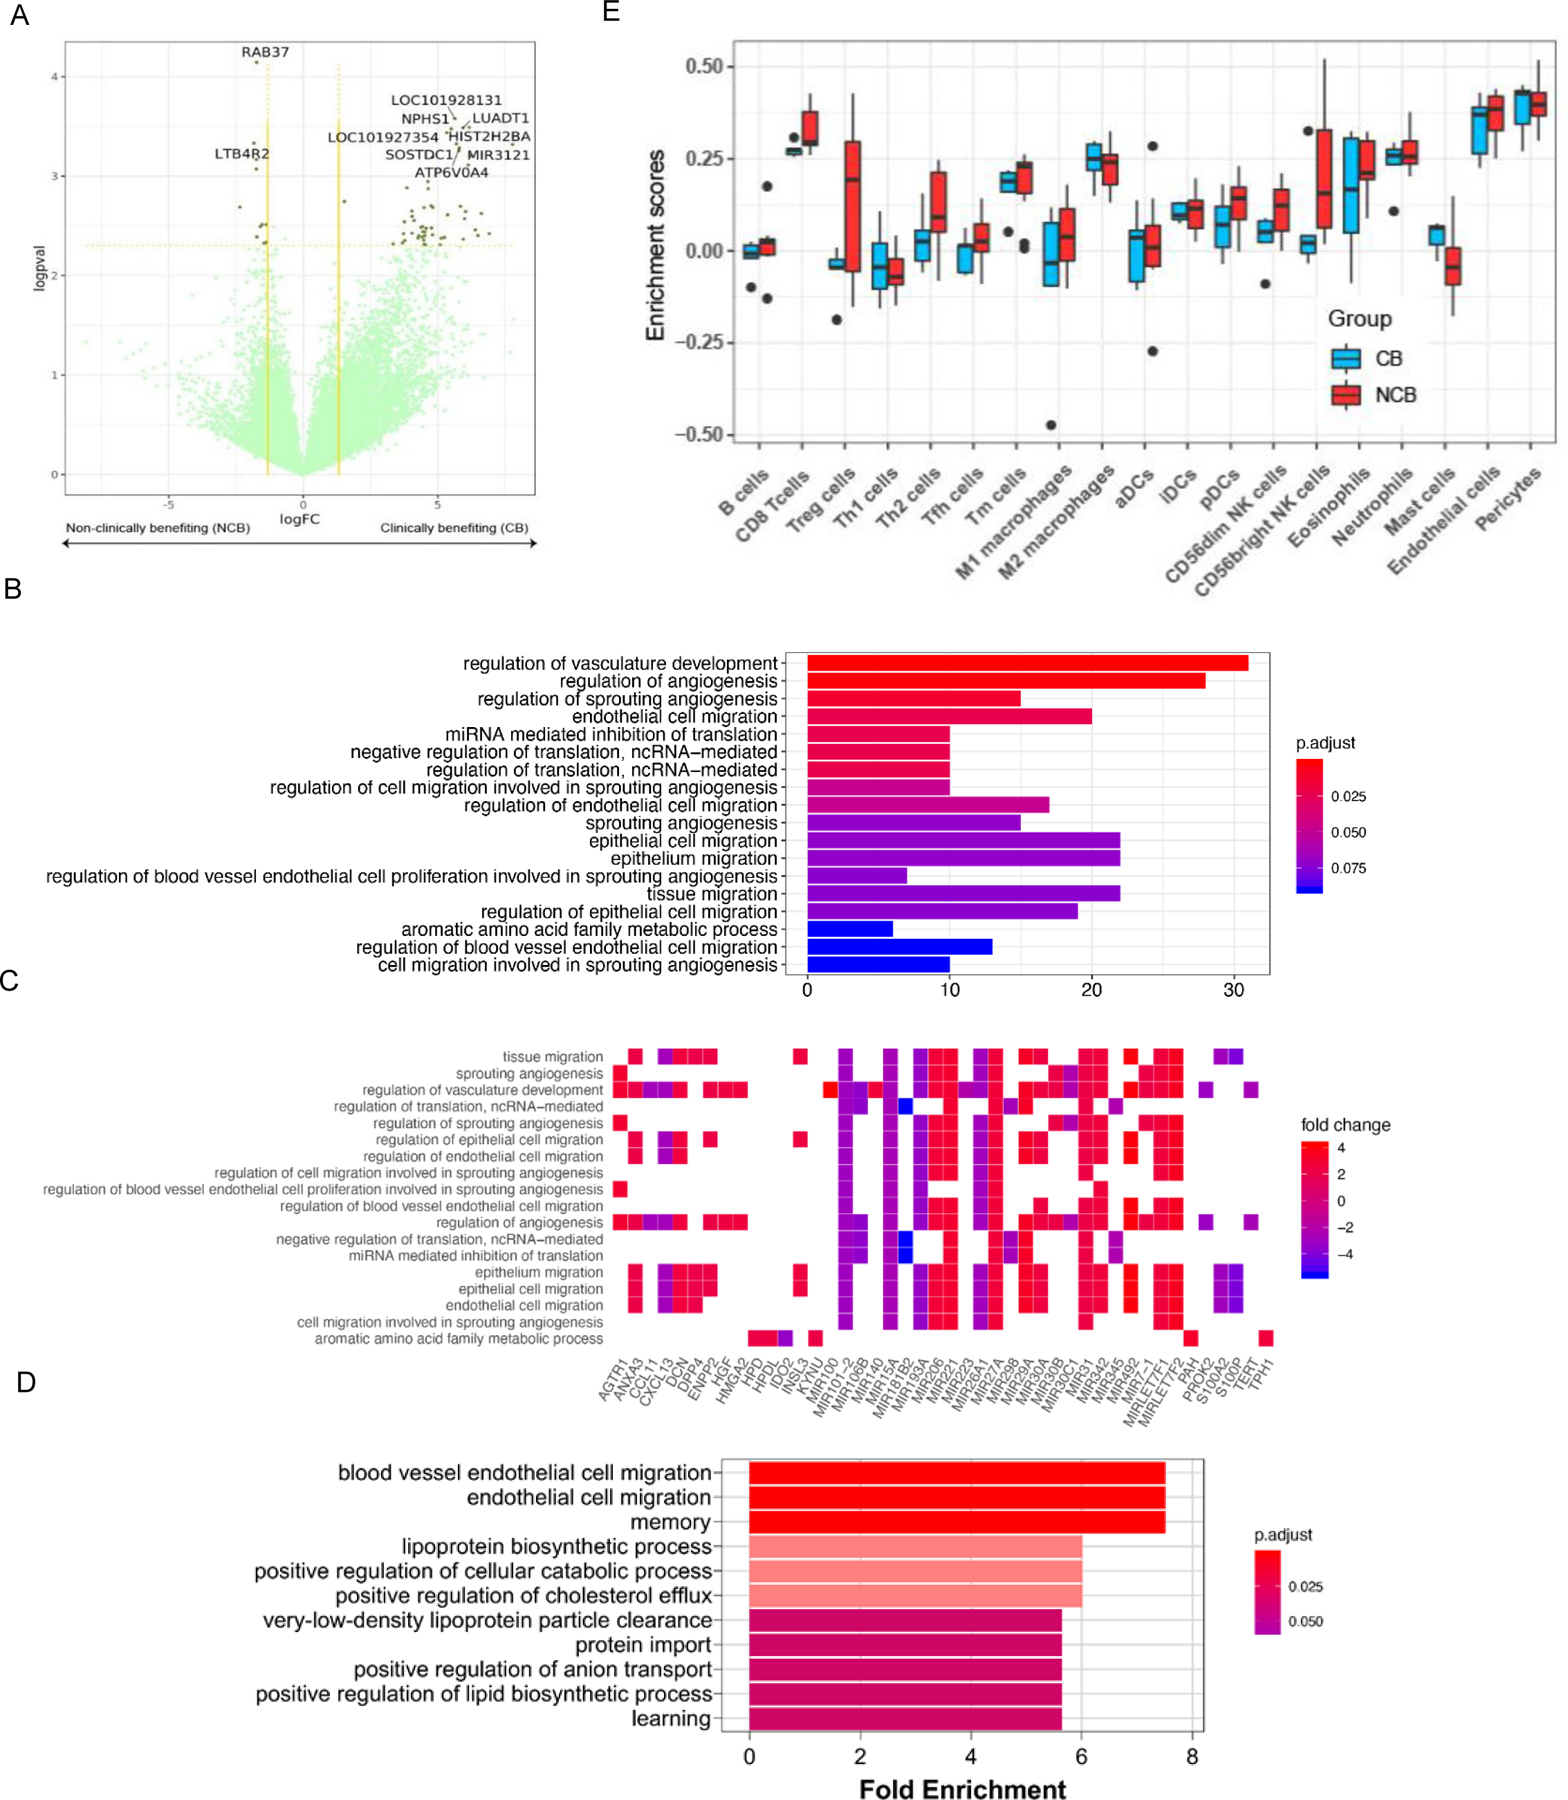
Fig. 3. RNA-seq analysis and proteomics/mass spectrometry investigation of tumor tissue in clinically benefiting (CB) vs. non-clinically benefiting (NCB) patients.

(A) Differential gene expression analyses for clinically benefiting (CB) vs. non-clinically benefiting (NCB) patients to SAbR+IL-2. Gene expression has been denoted as logarithm of the fold change (logFC) values along the x-axis. The negative logarithm of p-values (logpval) have been plotted along the y-axis. Vertical yellow lines along the logFC value 1.5 on both sides and a horizontal yellow line along the p-value=0.1 have been used as cut-offs for gene expression to be considered real gene expression. (B) Gene ontology pathway analysis, including both up- and downregulated genes, of CB compared to NCB. The 18 most significantly different pathways have been represented in the bar chart. False discovery rate (FDR) adjusted p-values were plotted as the heights and the colors of the bars. (C) A heat map showing log fold changes of the expression levels of the most overlapping genes (CB over NCB) in the pathways that were most significant. (D) Gene ontology pathway analysis of upregulated proteins in responders compared to non-responders. From the significantly enriched pathways, the 11 pathways with the highest fold enrichment are represented in the bar chart. (E) Tumor immune infiltration at baseline in patients with CB as compared to those in NCB.
