
FIGURE 2.
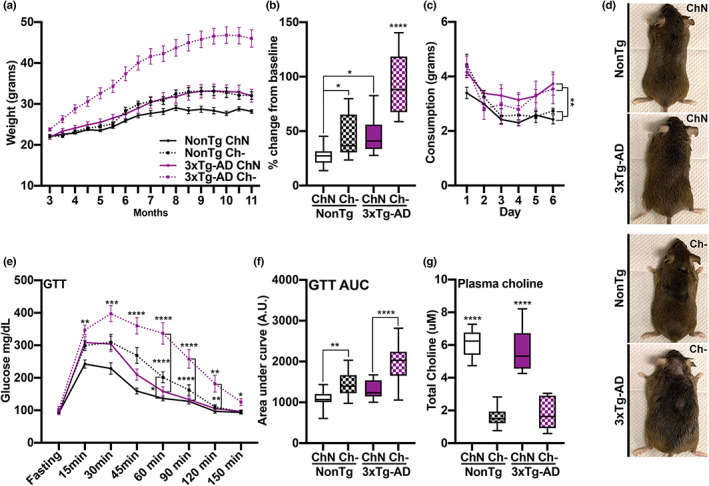
Ch‐ increases body weight, impairs glucose metabolism, and reduces plasma choline levels. (a) Body weight across age. (b) Percent weight change from baseline shows elevated levels in the NonTg Ch‐ mice compared to NonTg ChN mice (p = 0.026) and in the 3xTg‐AD Ch‐ mice compared to 3xTg‐AD ChN mice (p < 0.0001). (c) 3xTg‐AD mice had significantly higher food intake across the 6 days of the food consumption test than the NonTg mice (p = 0.0042), but no diet effect was detected. (d) Representative images of mice illustrating weight differences. (e) Ch‐ mice had significantly higher glucose levels in the glucose tolerance test (GTT) than ChN mice (p < 0.05). 3xTg‐AD Ch‐ mice had significantly higher glucose levels in the GTT from the 60 min through 120 min timepoints than their ChN counterparts (p < 0.01). NonTg Ch‐ mice had significantly higher glucose levels than their ChN counterparts at the 60 min time point (p < 0.05). (f) GTT area under the curve (AUC) analysis showed higher levels in NonTg Ch‐ mice than their ChN counterparts (p = 0.0042), and 3xTg‐AD Ch‐ mice had higher levels than their ChN counterparts (p < 0.0001). (g) Ch‐ significantly reduced plasma choline levels (p < 0.0001). Line graphs are mean ± SE. For box plots, the center line represents the median value the limits represent the 25th and 75th percentile, and the whiskers represent the minimum and maximum value of the distribution. *p < 0.05, **p < 0.01, ***p < 0.001, ****p < 0.0001