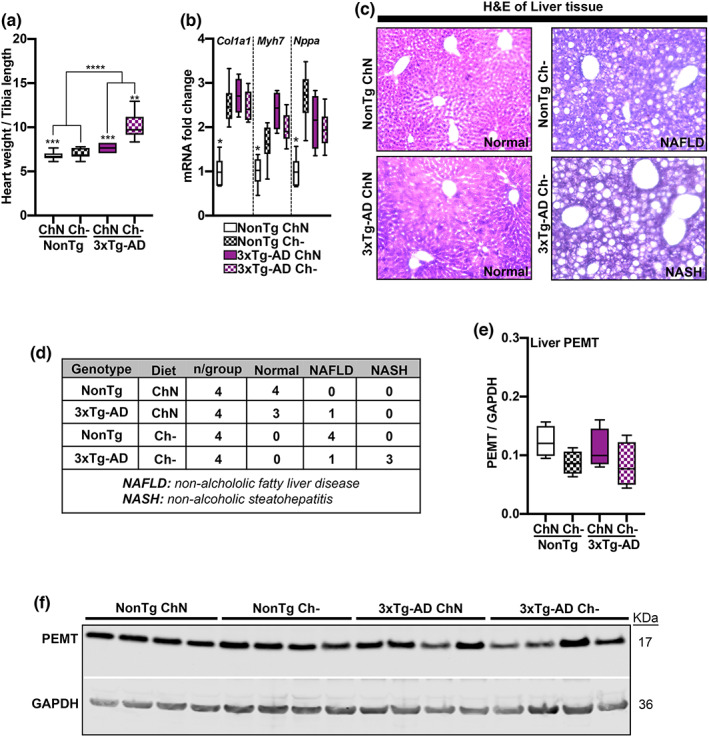
FIGURE 3.

Ch‐ induces cardiac and liver pathology. (a) 3xTg‐AD mice had a higher heart weight than NonTg mice (p < 0.0001), and the Ch‐ groups had higher heart weights than the ChN mice (p = 0.001). 3xTg‐AD Ch‐ mice had the highest heart weight (p = 0.0018). (b) mRNA expression levels of Col1a1, Myh7, and Nppa were elevated in 3xTg‐AD ChN mice and both NonTg and 3xTg‐AD Ch‐ mice compared to the NonTg ChN group (p < 0.05). (c) Photomicrographs of liver tissue stained with Hematoxylin and Eosin (H&E). (d) Table reporting liver pathology in Ch‐ mice. (e,f) Western blot and quantification for PEMT illustrate no differences across groups. For box plots, the center line represents the median value the limits represent the 25th and 75th percentile, and the whiskers represent the minimum and maximum values of the distribution. *p < 0.05, **p < 0.01, ***p < 0.001, ****p < 0.0001
