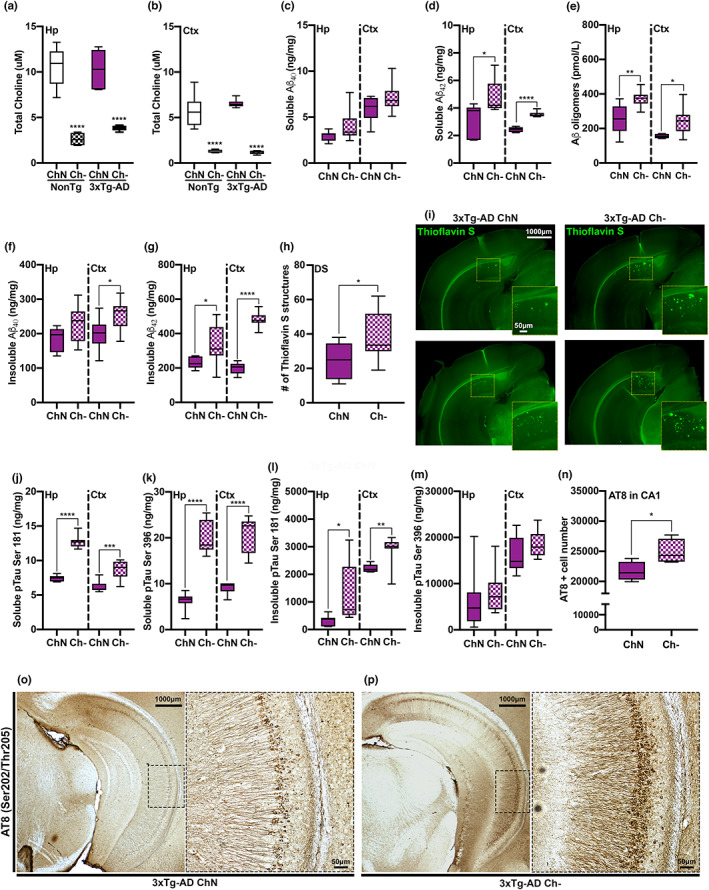
FIGURE 4.

Ch‐ reduces hippocampal (Hp) and cortical (Ctx) choline levels and exacerbates soluble and insoluble amyloid‐β (Aβ) fractions and tau phosphorylation of pathological epitopes. (a, b) Hp (p < 0.0001) and Ctx (p < 0.0001) choline levels were significantly reduced in the Ch‐ mice compared to their ChN counterparts. NonTg mice do not display Aβ pathology and were therefore excluded from Aβ analyses. (c) No significant differences were detected in soluble Aβ40. (d) Soluble Aβ42 levels were significantly elevated in the Hp (p = 0.014) and Ctx (p < 0.0001) of 3xTg‐AD Ch‐ mice. (e) Aβ oligomer levels were significantly elevated in the Hp (p = 0.0054) and Ctx (p = 0.021) of 3xTg‐AD Ch‐ mice. (f) For insoluble Aβ40 levels, we found a non‐significant trend in the Hp (p = 0.077) and significantly elevated levels in the Ctx (p = 0.032) of 3xTg‐AD Ch‐ mice. (g) Insoluble Aβ42 levels were significantly elevated in the Hp (p = 0.035) and Ctx (p < 0.0001) of 3xTg‐AD Ch‐ mice. (h) Thioflavin S Aβ structure count was significantly higher in the dorsal subiculum (DS) of 3xTg‐AD Ch‐ mice. (i) Photomicrographs of Thioflavin S staining, two representative images per 3xTg‐AD group. (j) Soluble levels of phosphorylated tau (pTau) at serine (Ser)181 were significantly elevated in the Hp (p < 0.0001) and Ctx (p = 0.0009) of 3xTg‐AD Ch‐ mice. (k) Soluble levels of pTau at Ser396 were significantly elevated in the Hp (p < 0.0001) and Ctx (p < 0.0001) of 3xTg‐AD Ch‐ mice. (l,m) Insoluble levels of pTau at Ser181 were significantly elevated in the Hp (p = 0.0442) and Ctx (p = 0.0052) of 3xTg‐AD Ch‐ mice. No significant difference was observed for insoluble pTau at Ser396 in the Hp and Ctx. (n) AT8 (Ser202/Threonine (Thr)205)‐positive cell numbers were significantly elevated in the CA1 region of the Hp of 3xTg‐AD Ch‐ mice (p = 0.049). (o,p) Photomicrographs of ventral Hp sections stained for AT8 at 2.5× and 10×. For box plots, the center line represents the median value, the limits represent the 25th and 75th percentile, and the whiskers represent the minimum and maximum value of the distribution. *p < 0.05, **p < 0.01, ***p < 0.001, ****p < 0.0001
