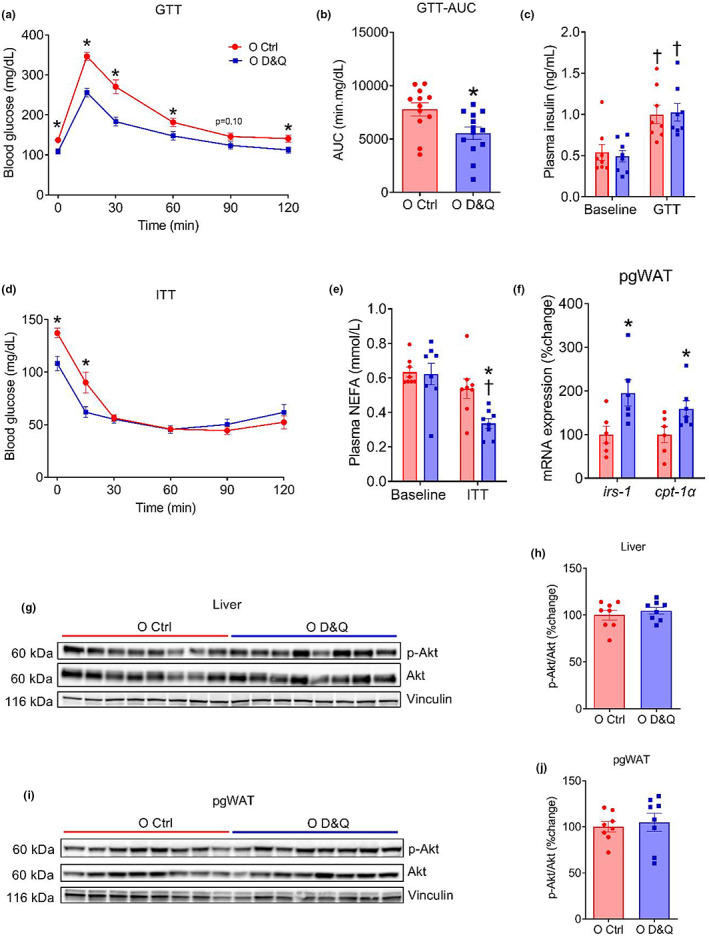
FIGURE 3.

Administration of D&Q ameliorates glucose tolerance and insulin‐stimulated NEFA suppression independent of the Akt signaling. (a and b) Blood glucose response curves and area under the curves (AUC) during glucose tolerance test (GTT: 2 g/kg, ip), (c) plasma insulin at baseline and during GTT, (d) blood glucose response during insulin tolerance test (ITT: 1 U/kg, ip), (e) plasma non‐esterified fatty acids (NEFA) at baseline and during ITT, (f) irs‐1 and cpt‐1α gene expression relative to 18s in pgWAT, (g–j) Western blot images and quantification for total Akt, phosphorylated Akt and vinculin form the liver and pgWAT. Data in the time response curves are shown as mean ± SEM. Other data are shown as mean ± SEM with individual data points in the bar graphs. N = 7–12/group. *Denote p ≤ 0.03 versus O Ctrl, †denote p ≤ 0.02 versus baseline. Group differences in GTT, ITT and plasma insulin at baseline and during GTT as well as plasma NEFA at baseline and during ITT were assessed by two‐way repeated measure ANOVA with Tukey's post hoc tests. Unpaired Student's t tests were used when comparing two groups.
