
FIGURE 1.
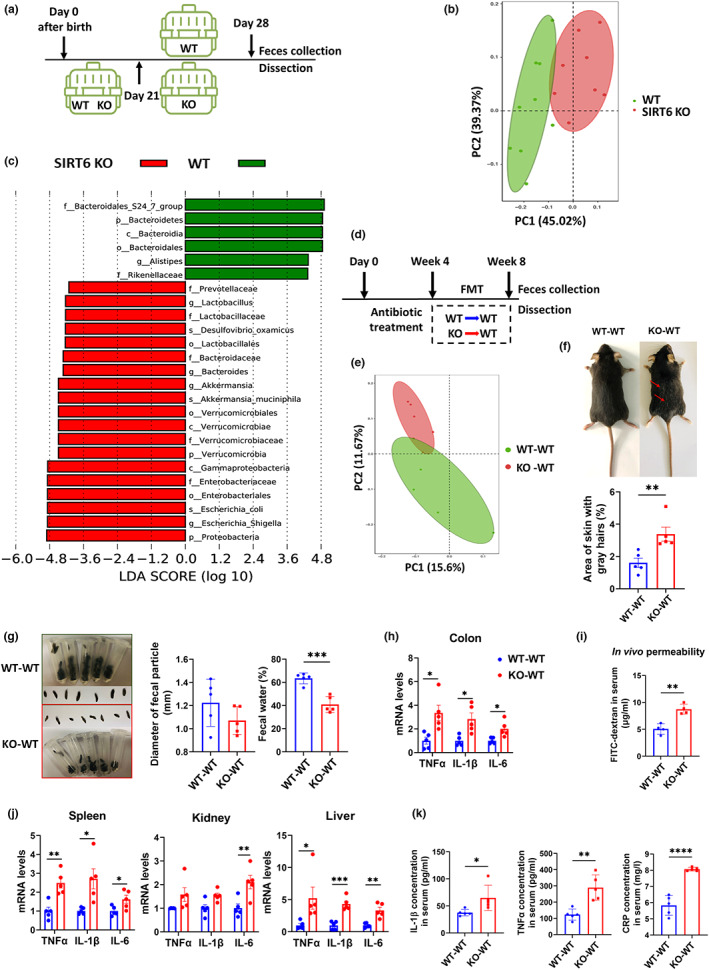
Gut dysbiosis of SIRT6 KO mice drives premature aging phenotypes in recipient WT mice through FMT. (a) Scheme of experimental design, in which the difference of gut microbiota between WT and SIRT6 KO mice (129S6/SvEvTac, 129Sv) was analyzed: Mice were individually caged from Day 21 after birth and were harvested at Day 28. (b) Principal Coordinates Analysis (PCoA) plot of weighted UniFrac distance (p = 0.001; AMOVA) between WT and SIRT6 KO mice. Each dot represents an individual mouse (WT, n = 9; SIRT6 KO, n = 8). (c) Results of LEfSe analysis show bacterial taxa compositions that were significantly different between SIRT6 KO and WT mice. LDA, linear discriminant analysis (WT, n = 9; SIRT6 KO, n = 8). (d) Experimental design of FMT. WT‐WT (C57BL/6J WT mice transplanted with fecal microbiota from 129Sv WT mice) and KO‐WT (C57BL/6J WT mice transplanted with fecal microbiota from 129Sv SIRT6 KO mice). Mice were treated for 4 consecutive weeks with an antibiotic cocktail in drinking water and then were given the microbiota suspension every other day for 4 weeks. Feces for further analysis were collected 72 h after FMT. (e) PCoA of weighted UniFrac distances between WT‐WT and KO‐WT mice (p = 0.243; PERMANOVA). Each dot represents an individual mouse (n = 5 per group). (f) Representative pictures of WT‐WT mice and KO‐WT mice. KO‐WT mice showed more gray hairs. More replicates were shown in Figure S3a. The area of skin gray hairs was quantified using Image J (n = 5 per group). (g) Appearances of feces. The diameter and water content of feces from WT‐WT and KO‐WT mice were measured (n = 5 per group). Each dot represents an individual mouse. (h) Relative mRNA expression of inflammatory factors, including TNFα, IL‐1β, and IL‐6, measured by qPCR, in colon tissue (n = 5 per group). (i) FITC‐dextran in vivo permeability assay in WT‐WT and KO‐WT mice (n = 4 per group). (j) Relative mRNA expression of inflammatory factors, including TNFα, IL‐1β, and IL‐6, measured by qPCR in the spleen, kidney, and liver (n = 5 per group). (k) Serum IL‐1β, TNFα, and CRP concentration (n = 5 per group). *p < 0.05, **p < 0.01, ***p < 0.001, ****p < 0.0001