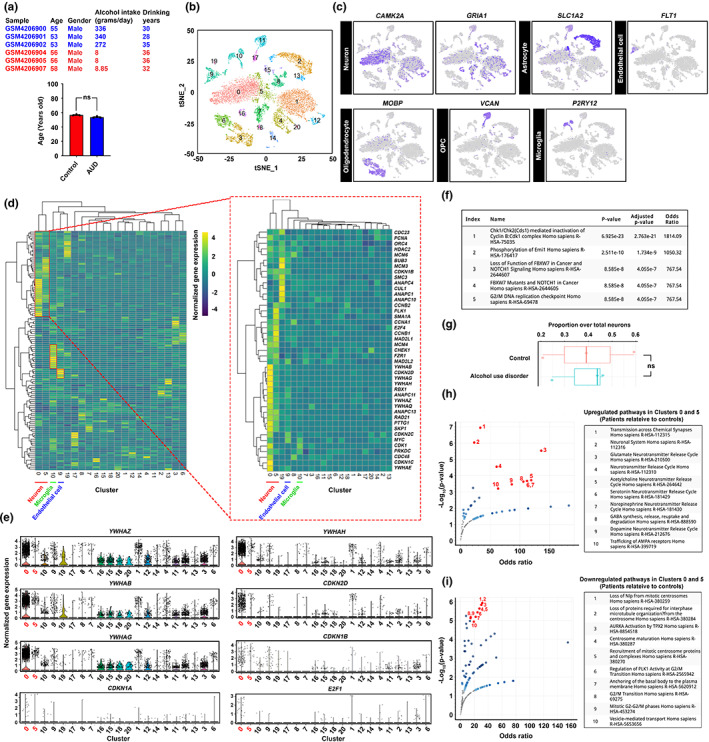
FIGURE 3.

Senescent neurons in the post‐mortem brain prefrontal cortex harvested from individuals with alcohol use disorders revealed unique transcriptomic features. (a) Single‐nuclei transcriptome profiling of an existing public dataset (GSE141552) was performed. Age‐ samples (i.e., control group = 56.67 ± 0.6667; AUD = 53.67 ± 0.6667) and sex‐matched samples were selected and analysed. (b) T‐distributed stochastic neighbour embedding (t‐SNE) plot of all nuclei extracted from the dataset, which was then segregated and coloured as 20 distinct clusters of brain cells, based on their transcriptome features. (c) Based on the known markers of the major cell types, clusters of neurons, astrocytes, endothelial cells, oligodendrocytes, oligodendrocyte progenitor cells (OPCs) and microglia were identified. (d) Targeted analyses of cell cycle‐associated genes obtained from the KEGG database (hsa04110) were performed. Heightened expression of cell cycle‐associated genes was observed in clusters 0 (neuron), 5 (neuron), 10 (microglia) and 10 (endothelial cells). (e) Violin plots indicate the expression levels of a number of cell cycle‐related genes that are mostly enriched in clusters 0 and 5. (f) Pathways of 42 cell cycle‐related genes enriched in clusters 0 and 5 relative to the rest of other neurons were clustered based on the Reactome database. The top 5 enriched pathways were listed. (g) The proportion of clusters 0 and 5 neurons over total neurons in control and AUD samples (N = 3, ns = non‐significant, two‐tailed unpaired t‐test). (h and i) Comparison of neurons in clusters 0 and 5 between AUD and control patient samples. With the Reactome pathway database, significantly (h) upregulated and (i) downregulated genes were clustered. The volcano plots indicated the odds ratio and significance of the enriched pathways. The top 10 pathways were listed.
