
FIGURE 1.
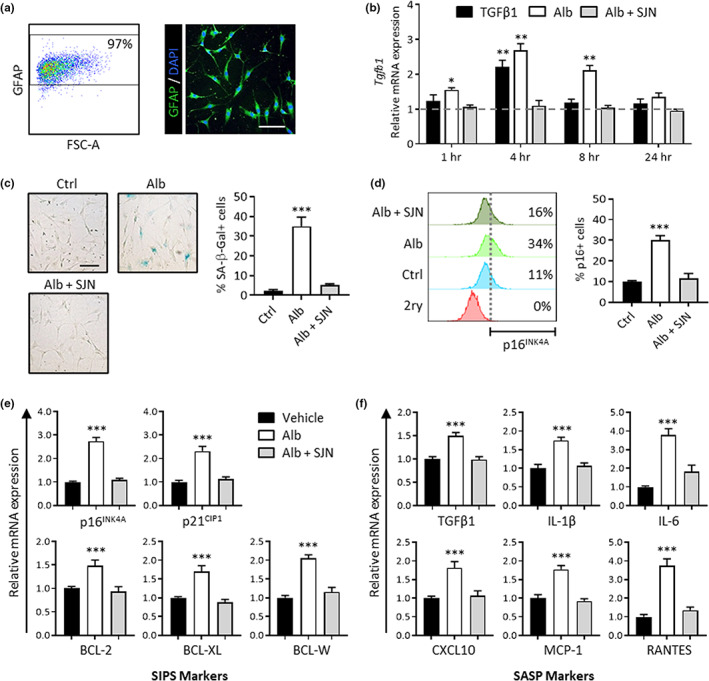
Albumin‐induced TGFβ signaling activation induces astrocyte senescence in cultured hippocampal astrocytes. (a) Representative dot plots and microscopy image show astrocytes isolated from P8 rat hippocampi were 97% GFAP positive and exhibit typical morphology with multiple processes. (b) The bar graph shows relative Tgfb1 mRNA expression levels against baseline (horizontal dotted line). Astrocytes exhibited a significant increase in Tgfb1 transcription upon exposure to albumin, reaching maximum Tgfb1 mRNA levels at 4 h after exposure. Albumin‐induced Tgfb1 transcription was blocked by TGFβR inhibition with SJN2511. (c) Left: representative brightfield images show 7 days of albumin exposure induces senescence‐associated morphological changes in astrocytes and increases SA‐β‐gal expression. Right: quantification via cell counting reveals a significant increase in the percentage of SA‐β‐gal‐positive cells in the albumin‐treated cells compared with the control, which was blocked by TGFβR inhibition with SJN2511. (d) Left: histograms depict the results of one representative flow cytometry experiment to illustrate the gating strategy applied for determining p16INK4A‐positive cells. The bottom (red) histogram represents the isotype control used to set the fluorescence detection threshold (vertical dotted line). Cells with fluorescent values above the threshold were considered positive for p16INK4A. Right: summary data of cell counts from all experiments show that treatment with albumin‐induced significant increases in the percentage of p16INK4A‐positive cells compared with control. SJN2511 treatment prevented the albumin‐induced increase in p16INK4A‐positive cells. (e) Gene expression analysis after 7 days of albumin exposure revealed increases in mRNA levels of genes encoding markers of stress‐induced premature senescence (SIPS) and (f) genes encoding components of the senescence‐associated secretory phenotype (SASP). Albumin‐induced upregulation of these genes was prevented by TGFβR inhibition with SJN2511. Scale bar: 100 μm. Bar graphs depict the mean ± SEM of three independent experiments. Asterisks denote a significant difference from baseline *p < 0.05, **p < 0.01, ***p < 0.001