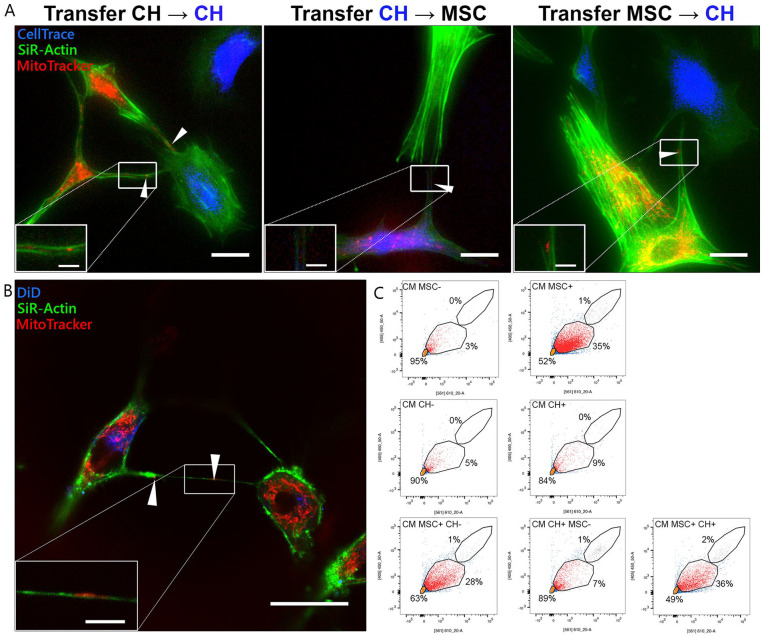
Figure 2.
Bidirectional transfer of mitochondria between cells. (A) Visualization of mitochondrial transfer among chondrocytes (CH), between CH and mesenchymal stromal cells (MSCs), and vice versa after 7 hours of coculture. Donating cells were stained with MitoTracker (in red), CH were stained with CellTrace (in blue), and F-actin of all cells was stained with SiR-Actin (in green). Mitochondria transported between 2 cell types are indicated by white arrows. Scale bar = 25 µm. Time-lapse videos can be found in the supplemental information. (B) Transport of mitochondria through a tunneling nanotube between MSC and CH. Donating MSCs were stained with DiD (in blue) and MitoTracker (in red). F-actin of all cells was stained with SiR-Actin (in green). Image taken after 16 hours of coculture. Scale bar = 25 µm. (C) Flow cytometry analysis of (co)culture conditioned media (CM) for small particles including mitochondria-containing microvesicles (in red). Noise and particles negative for both dyes are depicted in orange, and cells (upper gate) are depicted in gray. Intensity of MitoTracker (561/610 nm) is depicted on the x axis, and intensity of CellTrace (405/450 nm) is depicted on the y axis. MSC− and CH− are unstained. MSC+ and CH+ are dual-stained for MitoTracker and CellTrace. In unidirectional cocultures (lower panels, left and middle), the first cell type is dual-stained, while the other is unstained. In the bidirectional coculture (lower panel, right), both cell types are dual-stained. In all cases, 10,000 events were recorded.

