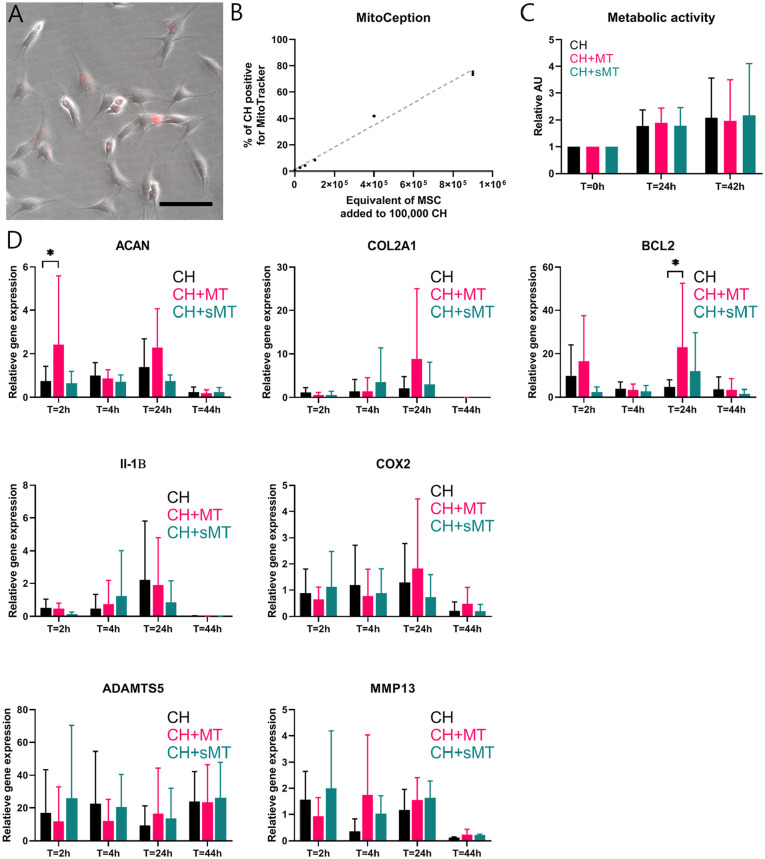
Figure 4.
Direct mitochondrial transfer through MitoCeption. Mitochondria (MT) of 900,000 mesenchymal stromal cells (MSCs) were isolated and transferred into chondrocytes (CH) via MitoCeption. CH controls were subjected to the same centrifugation steps without the addition of MT. (A) MSC-derived MT, stained with MitoTracker (in red), localized intracellularly in CH monolayers. Scale bar = 100 µm. (B) Dose-dependent effect of MitoCeption using increasing concentrations of MT transferred into monolayers of 100,000 CH. Symbols depict averages of 2 measurements ± standard deviation, and the gray line shows linear regression. (C) Metabolic activity of CH monolayers as indicated by the conversion of resazurin to resorufin (ex: 560 nm, em: 590 nm) at 24 and 42 hours after MitoCeption with MT and senescent MT (sMT), both derived from 900,000 MSCs. N = 3 donor combinations. (D) mRNA expression of aggrecan (ACAN), type II collagen (COL2A1; both markers for chondrogenesis), and B-cell lymphoma 2 (BCL2; marker for cell survival) in CH monolayers at 2, 6, 26, and 46 hours after MitoCeption with MT and sMT derived from 900,000 MSCs. ACAN expression was increased in CH + MT compared with CH right after MitoCeption (T = 2 hours), and BCL2 was increased in CH + MT 26 hours after MitoCeption (T = 26 hours). N = 3 donor combinations, 2 technical replicates per donor. *P < 0.05. Error bars show standard deviations.

