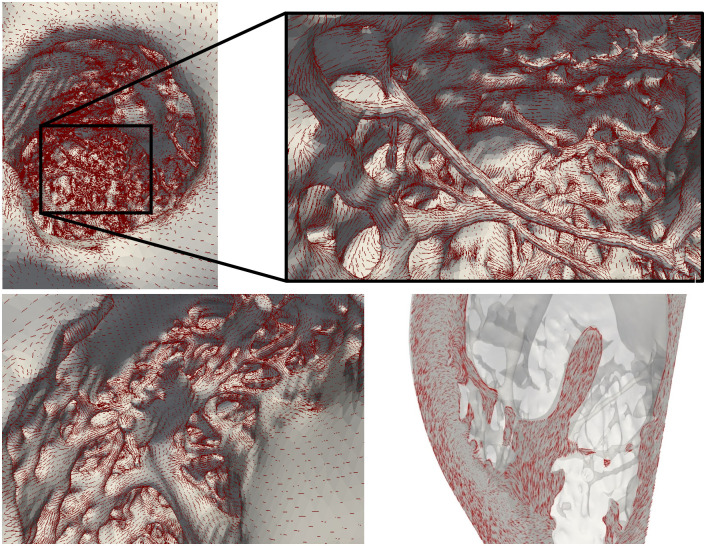
Fig 3. Illustration of the level of detail in the models (geometry A) with fibers, represented by red lines, overlayed.
Top: Left ventricular endocardium with focus on the longest false tendon. Bottom: Right ventricular endocardium. The fiber transition between the trabeculae and papillary muscle is observed in the right panel.

