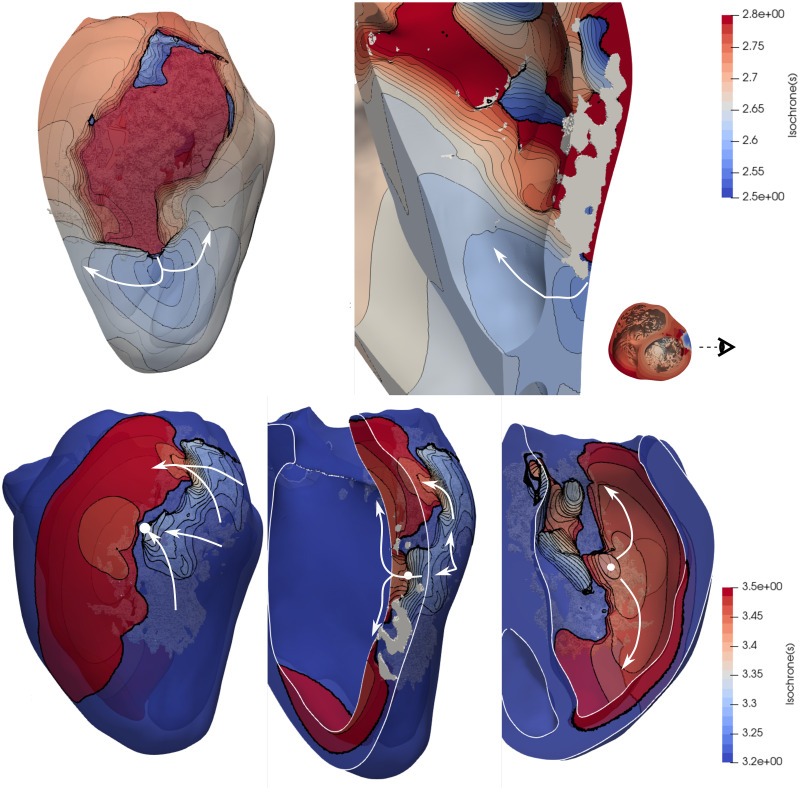
Fig 11. Isochrone map of the ventricular tachycardia obtained from the female smooth simulations with RVApex stimulus location (same as in Fig 9B) at two different time intervals shown in the color bars.
Dense scar is observed in white color. A white circle shows a transmural channel, which provides a different reentry pathway to the shown in Fig 10. S2 Video in S1 File shows this VT.

