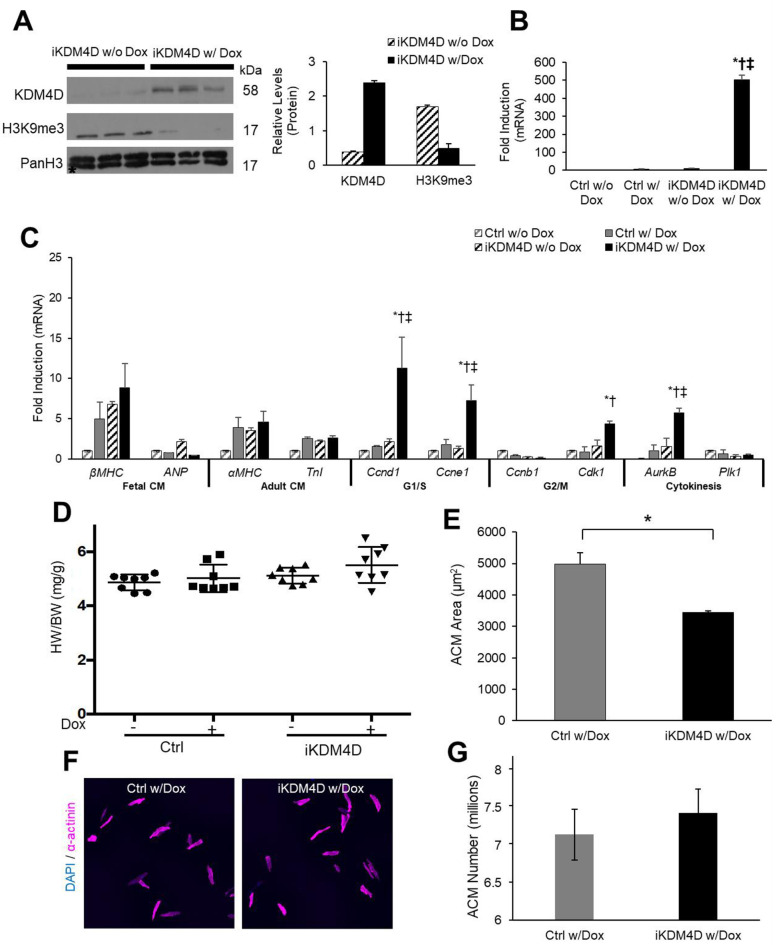
Fig 4. Inducible KDM4D mouse model.
(A) Immunoblotting of ACM lysates (left) showing CM-specific KDM4D protein induction in iKDM4D hearts and depletion of H3K9me3 with two weeks of induction in ACMs. Densitometry analysis (right) shows KDM4D, and H3K9me3 levels relative to PanH3 control in iKDM4D CMs with (n = 3) and iKDM4D CMs without (n = 3) doxycycline induction. * p<0.05. (B) KDM4D transgene expression is robustly induced in iKDM4D ACMs fold induction vs. control (-Dox), expression normalized to Gapdh. (C) Expression of CM and cell cycle genes in isolated ACMs measured by qRT-PCR, fold induction vs. control (-Dox), expression normalized to Gapdh. (D) HW/BW quantification in uninduced control and iKDM4D mice (-Dox) and induced in control and iKDM4D (+Dox). (E, F, G) Quantification of ACM area (μm2) and ACM number, isolated 12-wk CMs control, and iKDM4D (+Dox). Sample Number: (A) iKDM4D (-Dox) = 3, iKDM4D (+Dox) = 3. (B) All groups = 8 (C) Control (+Dox) = 3, iKDM4D (+Dox) = 3 (D-G) ≥3 animals per group. Statistics: (A) Two-tailed t-test, iKDM4D (-Dox) vs iKDM4D (+Dox), *P < 0.05. (B) Two-way ANOVA/Tukey’s test, * p<0.05 vs. ctrl (-Dox), † p<0.05 vs. ctrl (+Dox), ‡ p<0.05 vs. iKDM4D (-Dox). (C) Two-way ANOVA/Tukey’s test, *P < 0.05 vs. ctrl (Dox), †P < 0.05 vs. iKDM4D (-Dox), ‡P < 0.05 vs. ctrl (+Dox). (D) Two-way ANOVA/Tukey’s test, P > 0.05 vs. Control (-Dox). (E) Two-tailed t-test, control (+Dox) vs. iKDM4D (+Dox), *P < 0.05.

