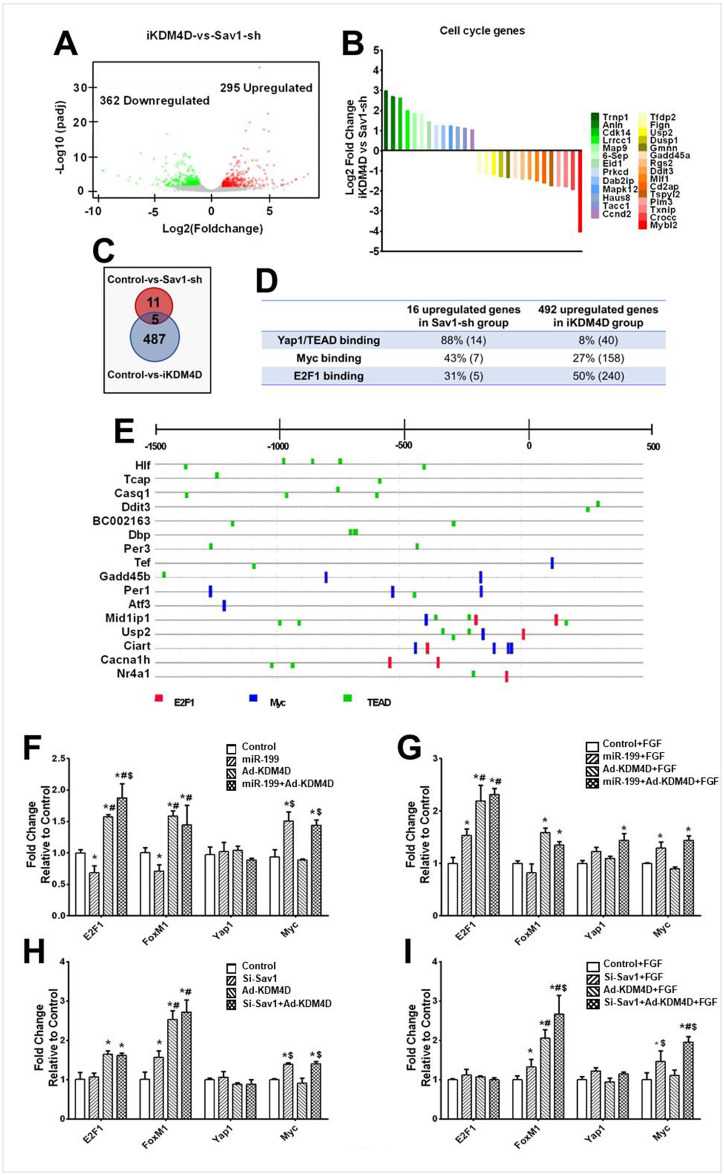
Fig 6. Transcriptional analysis of Sav1-sh and iKDM4D treated cardiac myocytes in vivo.
(A) The global transcriptional change in the iKDM4D groups compared with Sav1-sh was visualized by a volcano plot. Each data point in the scatter plot represents a gene. The log2 fold change of each gene is represented on the x-axis and the log10 of its adjusted p-value is on the y-axis. Genes with an adjusted p-value less than 0.05 and a log2 fold change greater than 1 represent upregulated genes (red dots). Genes with an adjusted p-value less than 0.05 and a log2 fold change less than -1 represent downregulated genes (green dots). (B) Fold change of 28 cell cycle genes in iKDM4D group compared to Sav1-sh. (C) Summary of upregulated genes in Sav1-sh and iKDM4D group compared to control group. (D) Summary of promoter binding site analysis on upregulated genes in Sav1-sh and iKDM4D groups. Percentage of genes for each binding site are shown. The number in parenthesis represents the total number of genes. (E) Representative promoter binding site analysis. List promoters (-1500bp-500bp) of 16 upregulated genes in Sav1-sh group compared to control group. E2F1 binding site (red); Myc binding site (blue); TEAD binding site (green). (F, G, H, I) Expression of common cell cycle transcription factors after indicated treatments. Statistics: n = 3 for each group. * showed statistical significance at p<0.05 vs control (without miR-199, Ad-KDM4D, and FGF); # represented statistical significance at p<0.05 vs miR-199; $ mean statistical significance at p<0.05 vs Ad-KDM4D. One-way ANOVA followed by Tukeys’ Test.

