
Figure 4. Adjusted Results for Rates of Psychosis-Related Diagnoses and Prescriptions at Varying Levels of Cannabis Commercialization by Race and Ethnicity, 2003 to 2017.
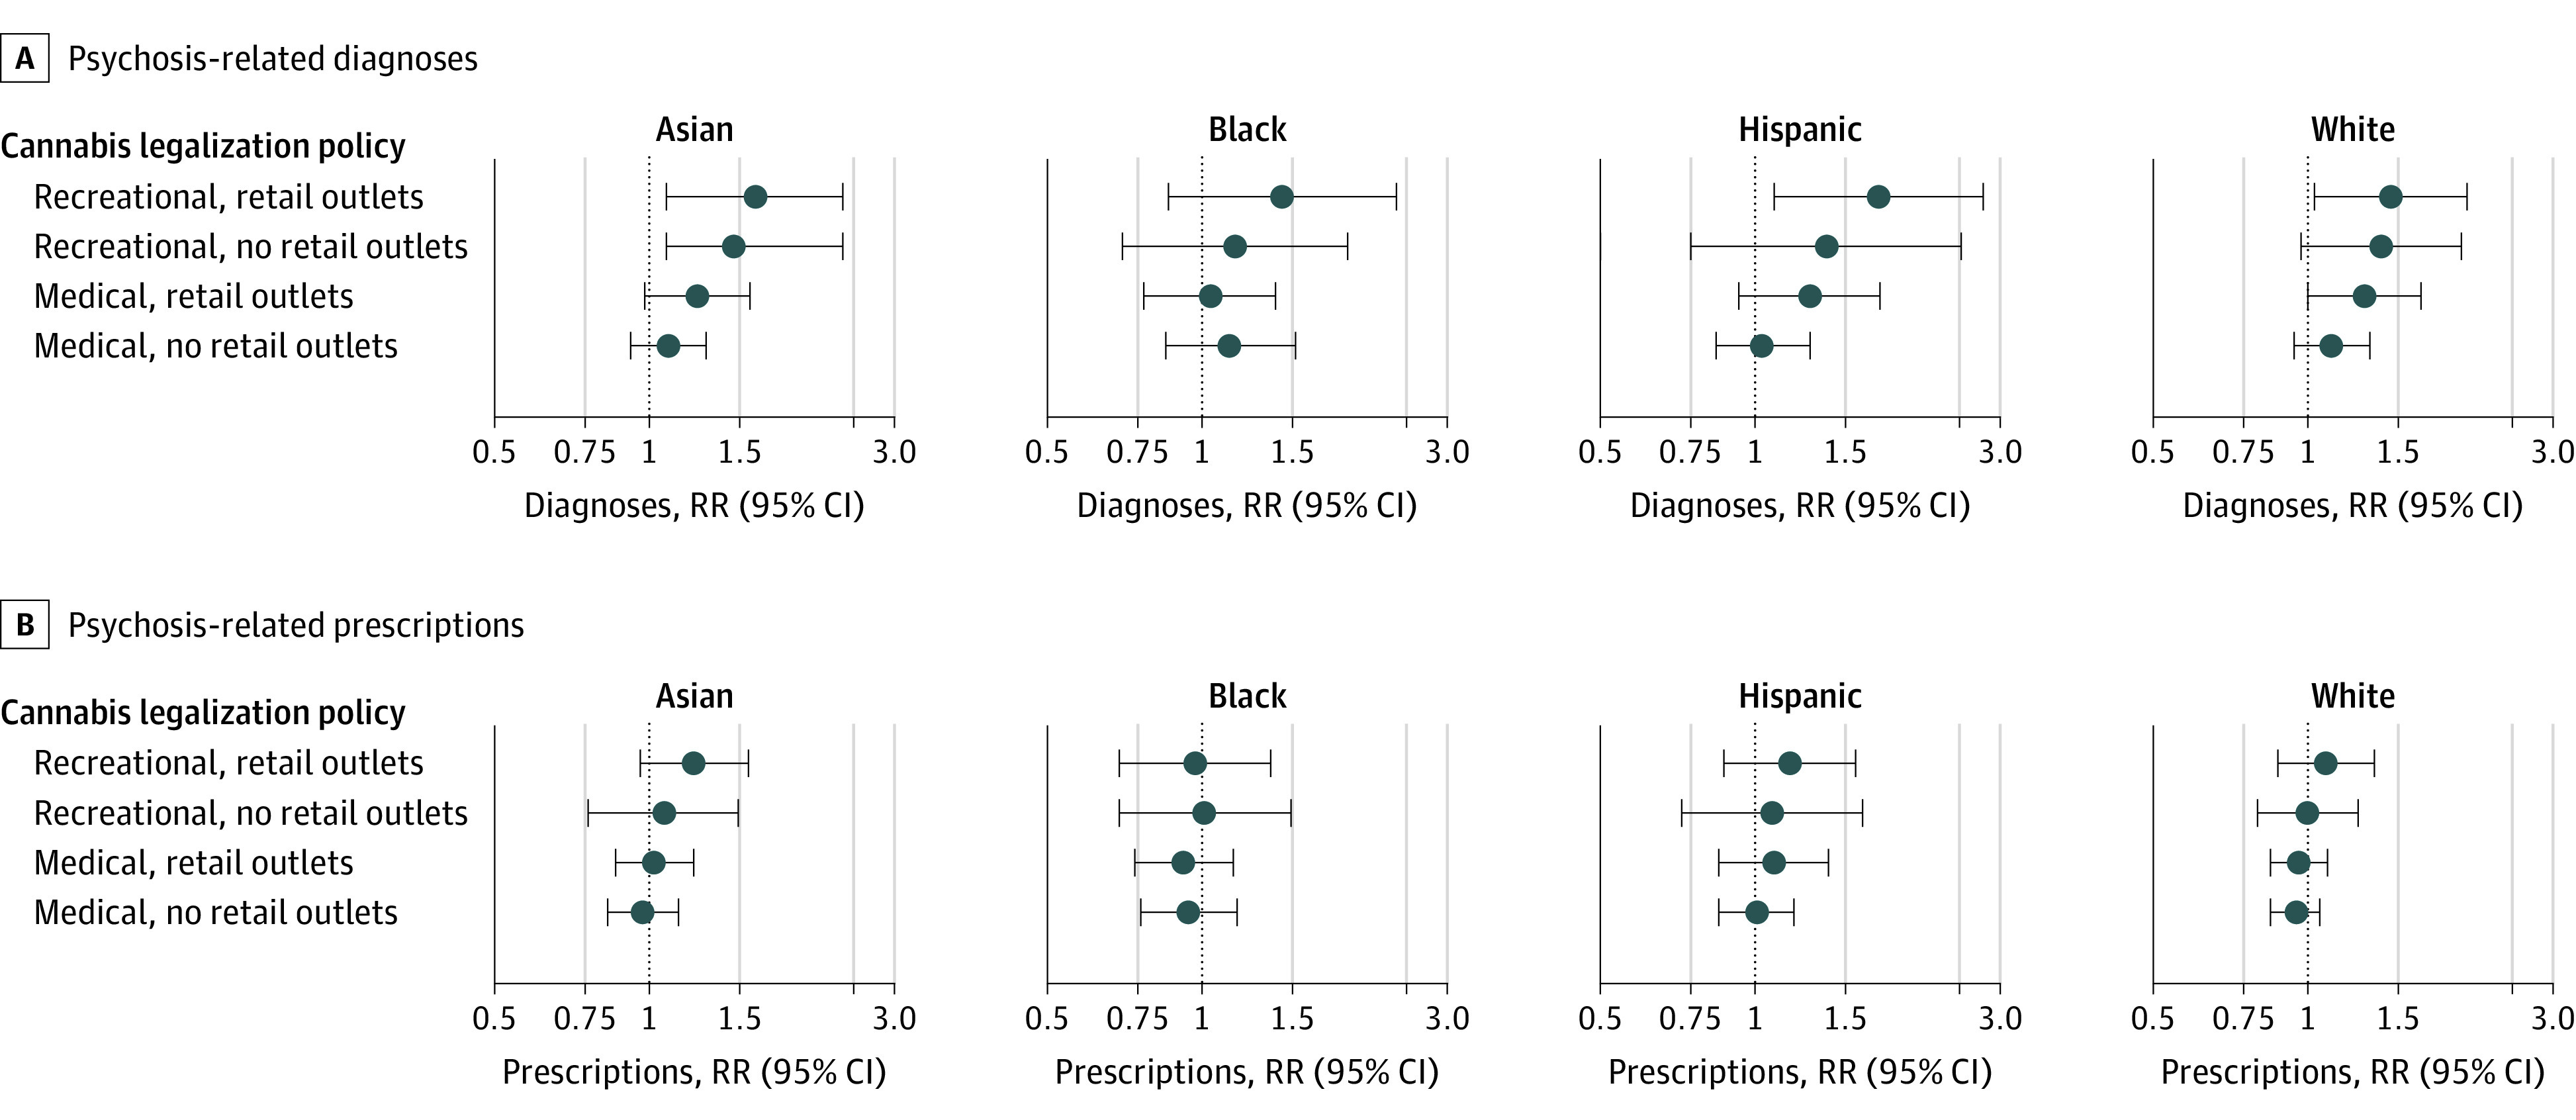
Rate ratios were calculated using negative binomial models with person-months at risk as the offset. Models were adjusted for state-level confounders including percent non-Hispanic Black, non-Hispanic Asian, and Hispanic; percent unemployed and percent renting their home; median income; and the overall claims rate. We included fixed effects for state, year, and calendar month to address spatial and temporal autocorrelation. 95% CIs were calculated with robust standard errors to account for repeated observations within states over time. Because of sparsity of observations across covariate strata, for subgroup analysis among Asian beneficiaries we excluded observations from the 4 states with the fewest Asian beneficiaries (Vermont, South Dakota, Montana, and Alaska) to calculate cluster robust standard errors (0.09% of follow-up time in this subgroup).