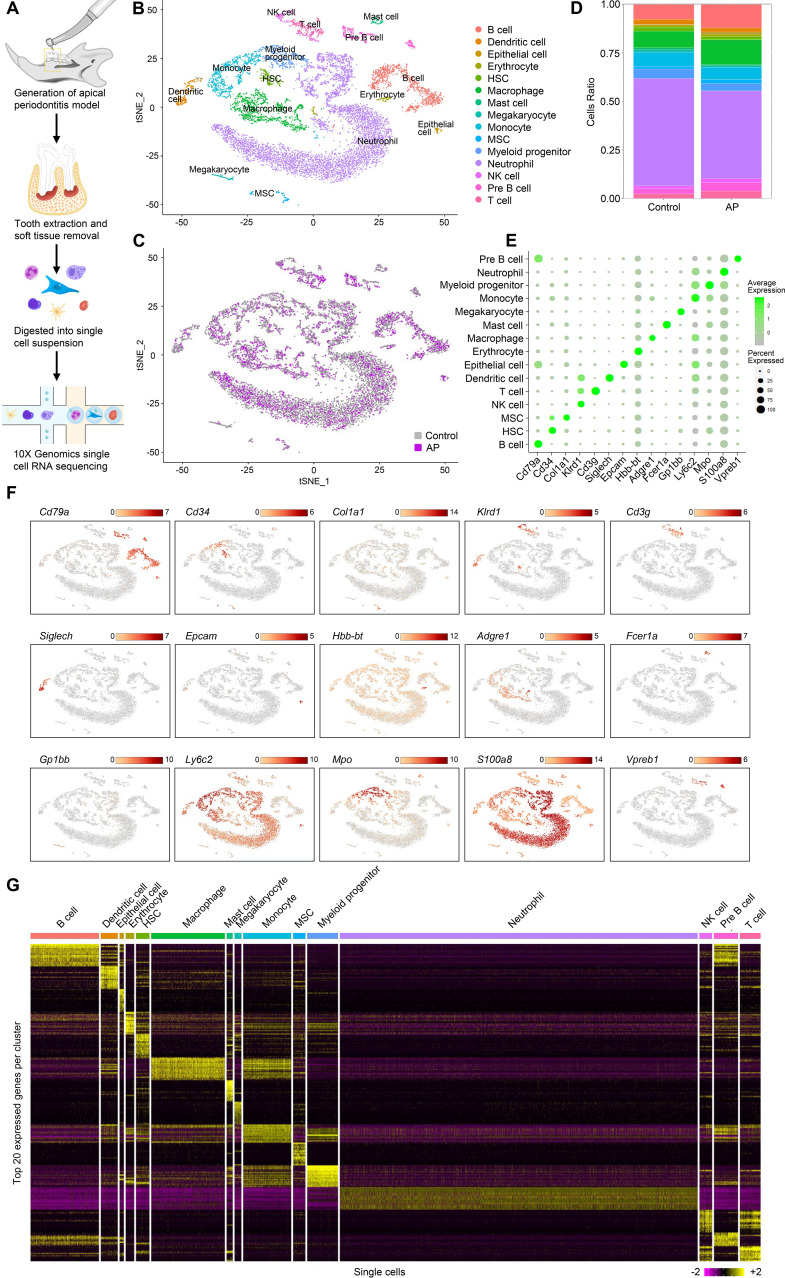
Figure 1. Identification of the single-cell atlas of alveolar bone using scRNA-sequencing (scRNA-seq) and unbiased clustering.
(A) Schematic diagram of the experimental design. (B–C) t-Stochastic neighbor embedding (t-SNE) representation of aligned gene expression data in single cells extracted from mandibles of control mice (n=8340) and apical periodontitis (AP) mice (n=6808) showing 15 distinct clusters and cellular origin. (D) Relative abundance of 15 cell populations composing alveolar bone under healthy and AP conditions. (E) Expression of gene markers in distinct cell types. (F) Gene expression patterns projected onto t-SNE plots of marker genes. Scale: log-transformed gene expression. (G) Heatmap showing the 20 most upregulated genes (ordered by decreasing Padj value) in each cluster defined in B. Scale: log2 fold change.


