. 2023 Feb 1;12:e82537. doi: 10.7554/eLife.82537

Figure 5. Identification and characterization of apical periodontitis (AP)-associated mesenchymal stem cell (MSC) population and its subclusters.

(A) t-Stochastic neighbor embedding (t-SNE) representation an unsupervised clustering of single cells within the MSC cluster. (B) Violin plots of MSC subcluster-specific expression of representative genes. (C) The percentages of four subclusters of MSC population were quantified in control and AP groups. (D) Violin plots depict the changes in the expression of top upregulated genes in the MSC cluster. (E and F) Immunofluorescence double staining of Sparc (E) and Col1 (F) in Sp7-expressing osteoprogenitors. Scale bar, 50 μm. (G) Immunofluorescence double staining of Runx2 in Gli1+ periodontal stem cells (PDLSCs). Scale bar, 50 μm. (H) Lineage tracing analysis of Lepr+ PDLSCs and Col2.3+ osteoblasts. Scale bar, 50 μm.

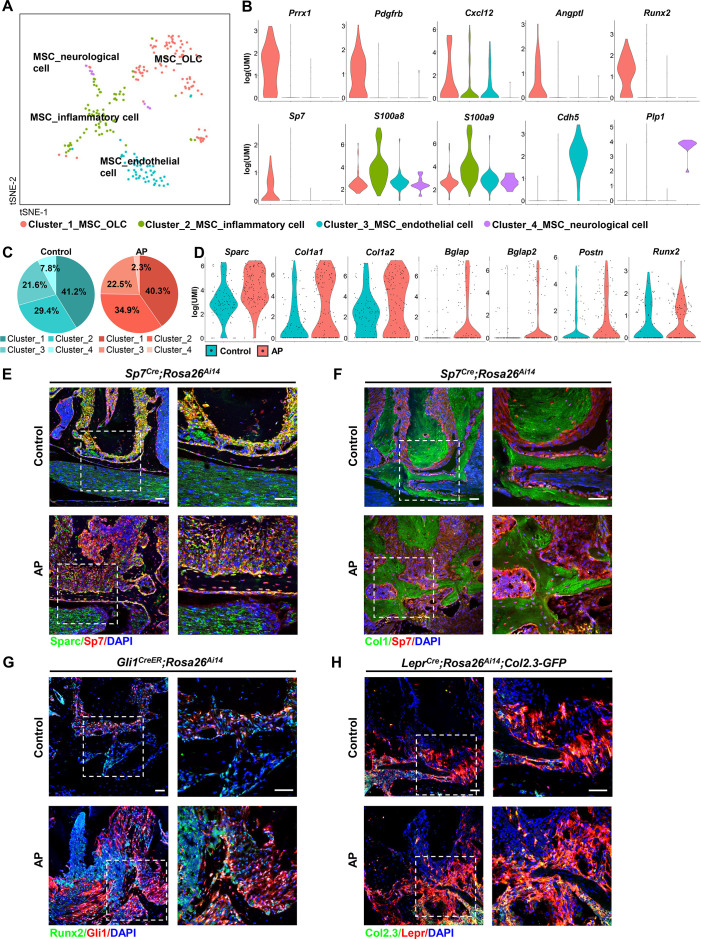
Figure 5.

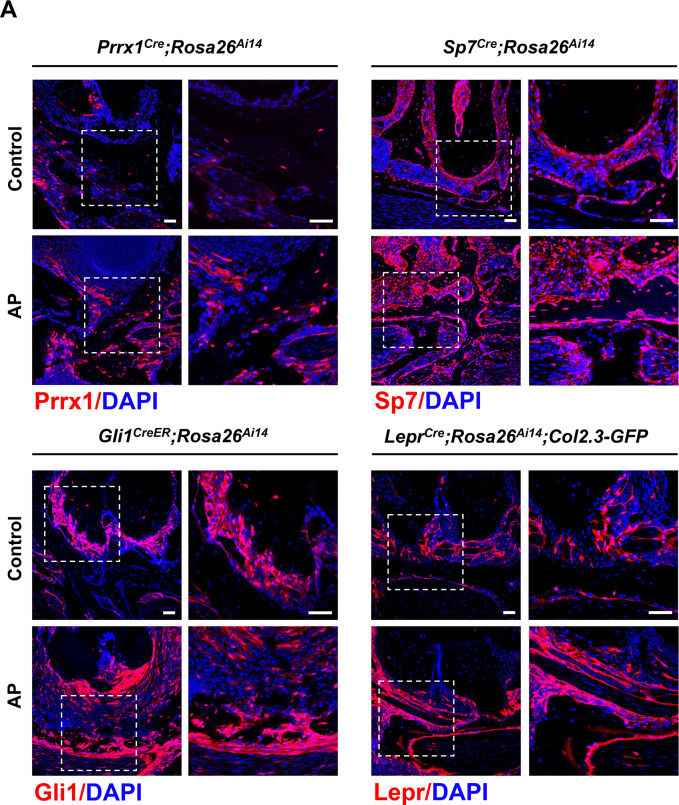
Figure 5—figure supplement 1. Red fluorescent protein expression in Prrx1Cre;Rosa26Ai14, Sp7Cre;Rosa26Ai14, Gli1CreER;Rosa26Ai14, and LeprCre;Rosa26Ai14;Col2.3-GFP mouse models.

Figure 5—figure supplement 1.

Scale bar, 50 μm.
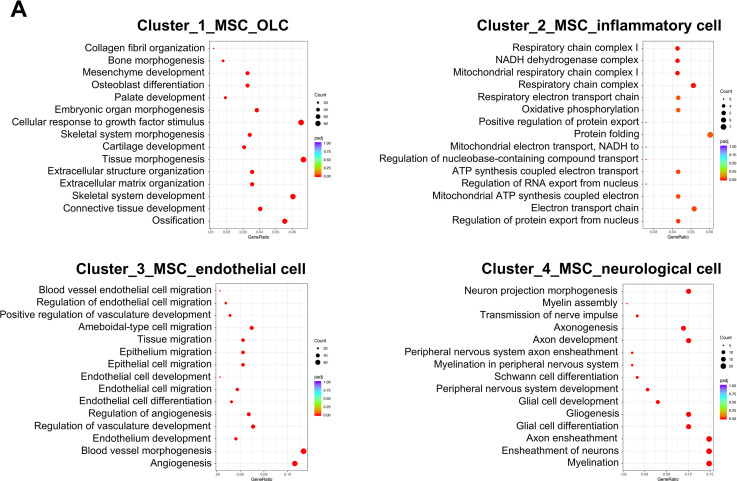
Figure 5—figure supplement 2. Gene Ontology (GO) enrichment analysis of the biological functions of mesenchymal stem cell (MSC) subclusters.

Figure 5—figure supplement 2.

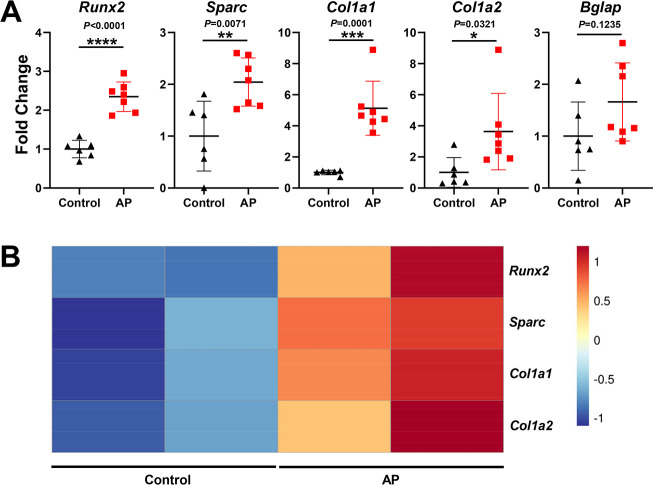
Figure 5—figure supplement 3. Real-time quantitative PCR (qPCR) and bulk RNA-seq analysis of osteogenic markers during apical periodontitis (AP) situation.

Figure 5—figure supplement 3.

(A) Gene expression of Runx2, Sparc, Col1a1, Col1a2, and Bglap in samples of control and AP mouse mandibles. n=6 in control group and n=7 in AP group. *p<0.05, **p<0.01, ***p<0.001, and ****p<0.0001. All data were exhibited as mean ± SEM. (B) Heatmap of representative genes associated with osteogenesis in bulk RNA-seq analysis.