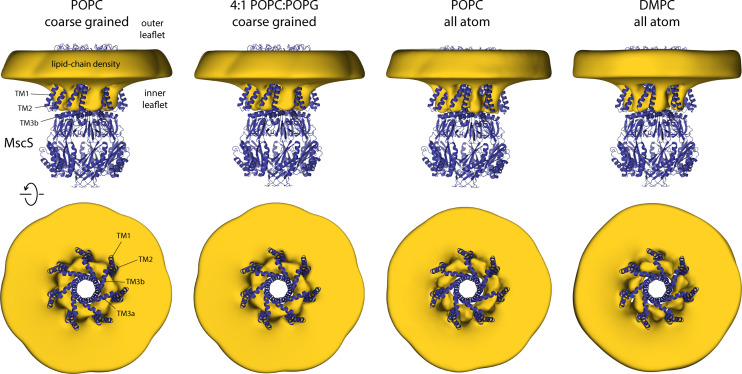
Figure 4. Closed-state MscS induces drastic perturbations of the lipid bilayer.
The figure summarizes the results from multiple simulations of the closed structure of MscS in different membrane compositions and using different forcefield representations (Table 1). The cryo-electron microscopy (EM) structure of MscS (blue cartoons) is overlaid with calculated 3D density distributions mapping the morphology of the alkyl chain bilayer in each of the molecular dynamics (MD) trajectories (gold volume), up to 50 Å from the protein surface. Protein and density maps are viewed along the membrane plane (top row) and along the pore axis, from the cytosolic side (bottom row); the latter includes only the transmembrane domain of the channel, for clarity. The calculated density maps derive from 20 µs of trajectory data for each of the coarse-grained systems and at least 8 µs of trajectory data for the all-atom systems.


