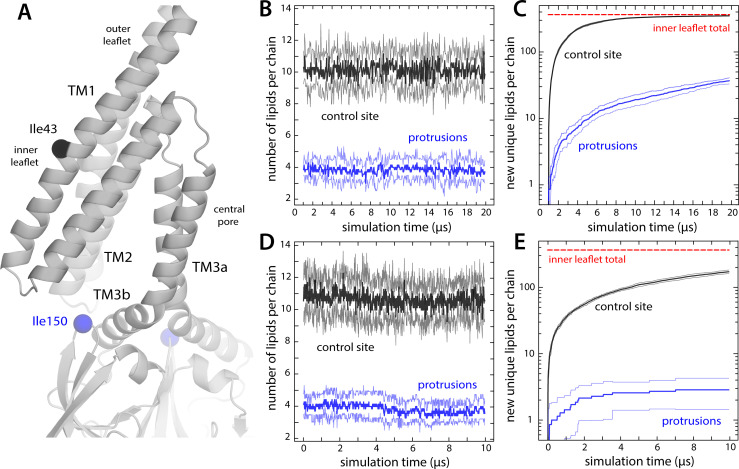
Figure 6. Lipids in inner-leaflet protrusions exchange with lipids in the bulk membrane.
(A) Close-up of one of the hydrophobic cavities that drive the formation of membrane protrusions in closed-state MscS. To identify which lipids reside in these protrusions and for how long, we monitored their distance to the Cα atom of residue Ile150; for comparison, we also tracked their distance to residue Ile43, which faces the inner leaflet of the (locally unperturbed) membrane. (B) Number of lipid molecules found at any given time in the inner leaflet protrusions (i.e. within 20 Å of Ile150; blue lines), in comparison with those found in proximity to Ile43 (black), during coarse-grained simulations of closed-state MscS in POPC (1-palmitoyl-2-oleoyl-sn-glycero-3-phosphocholine). The plot shows the average value for the seven protrusions (thick lines) as well as the variance in the observed values (thin lines). (C) Time-course of the number of new, unique lipids contributing to the populations shown in panel (B). Lipids in the first snapshot were not considered newly found; hence, all curves start from a value of 0. For comparison, the total number of lipid molecules in the inner leaflet is indicated (red line). Note that after 20 μs of coarse-grained (CG) simulation, all lipids in the inner leaflet have at some point been in proximity to each of the seven Ile43 residues, while about 40 different lipids have been at some point in each of the seven membrane protrusions. (D and E) Same as (B and C), for the analogous 10 μs all-atom simulation of closed-state MscS in POPC.

