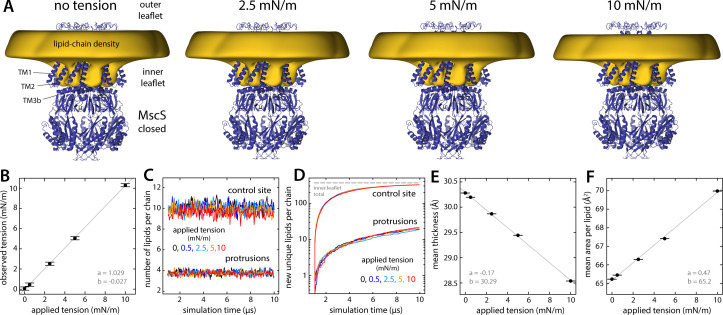
Figure 7. Persistence of lipid protrusions across increasing lateral tension conditions despite changes in global membrane properties.
The figure summarizes the results from simulations of the closed structure of MscS under different membrane tensions. (A) The cryo-electron microscopy (EM) structure of MscS in the closed state (blue cartoons) is overlaid with a calculated 3D density distribution mapping the morphology of the alkyl chain double layer in the molecular dynamics (MD) trajectory (gold volume), up to 50 Å from the protein surface. Protein and density maps are shown as in Figure 4. (B) The lateral tension reported by the MD engine during the simulations (in 500 ps intervals, then averaged) is compared with the target tension value in each case (see Materials and methods). Error bars denote the SEM. A line of best fit is shown superimposed (gray), along with the slope a and intercept b. (C) Number of lipids in the inner-leaflet protrusions and near control sites, calculated as described in Figure 6, for each tension condition (average values for control sites: 10.13, 10.09, 10.01, 9.86, and 9.50 lipids; for protrusions: 3.82, 3.83, 3.80, 3.77, and 3.73 lipids; for applied tensions of 0, 0.5, 2.5, 5, and 10 mN/m, respectively). (D) Lipid exchange between the bulk and the protrusions/control sites, for each tension condition, evaluated as in Figure 6. (E and F) Changes in mean membrane thickness and mean area per lipid as the applied lateral tension increases. Bulk values were computed by averaging all local values (mapped on a discrete lattice) at least 20 Å away from the surface of the protein. Bilayer thickness was evaluated using the glycerol groups. Area-per-lipid values were averaged across leaflets. Error bars represent the SEM.

