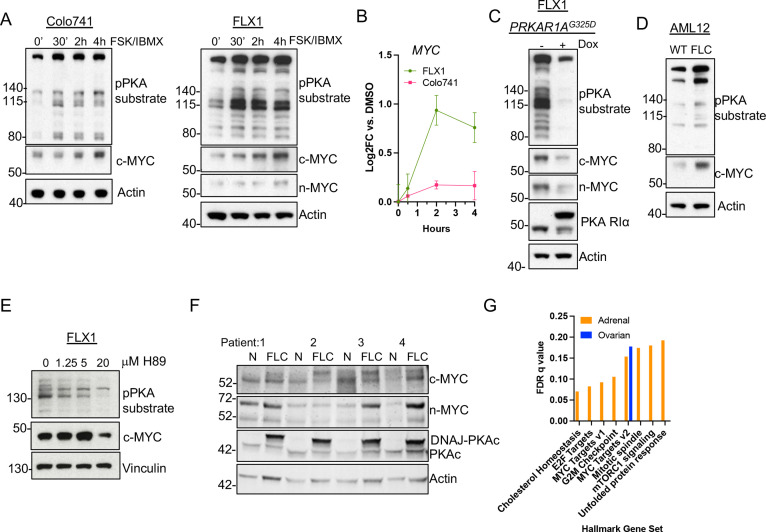
Figure 3. PKA activity correlates with c-MYC and n-MYC protein levels.
(A) Immunoblots showing the change of PKA activity, as indicated by phospho-PKA substrate, and c-MYC and n-MYC expression in Colo741 and FLX1 cells after treatment with 50 μM forskolin (FSK) and 3-isobutyl-1-methylxanthine (IBMX) for 30 min, 2 hr, or 4 hr. n-MYC was not detected in Colo741 so is not shown. (B) Impact of 0–4 hr treatment with FSK/IBMX on MYC mRNA levels in Colo741 and FLX1; ± SD. Technical replicates from a representative experiment shown. (C) Immunoblots showing the change of PKA activity and c-MYC and n-MYC levels in engineered FLX1 cells with doxycycline (dox)-inducible 3xFLAG- PRKAR1AG325D with or without dox for 72 hr. (D) Immunoblots showing the basal level of PKA activity with phosphorylated PKA substrate and c-MYC expression in AML12 wild type (WT; left) and AML12DNAJ-PKAc cells (right). (E) Effect of 4 hr treatment with PKA-inhibiting tool compound H89 over a dose range from 1.25 to 20 μM on PKA substrate phosphorylation and c-MYC level. (F) Immunoblot showing the presence of DNAJ-PKAc and different level of c-MYC and n-MYC in fibrolamellar carcinoma (FLC) tumor samples (FLC) vs adjacent liver (N) from four FLC patients. (G) Summary gene set enrichment analysis (GSEA) of PRKACA amplified/mutant and PRKAR1A inactivated adrenocortical carcinoma or ovarian serous carcinoma vs. WT from TCGA. All significant ‘Hallmark’ gene sets are shown.


