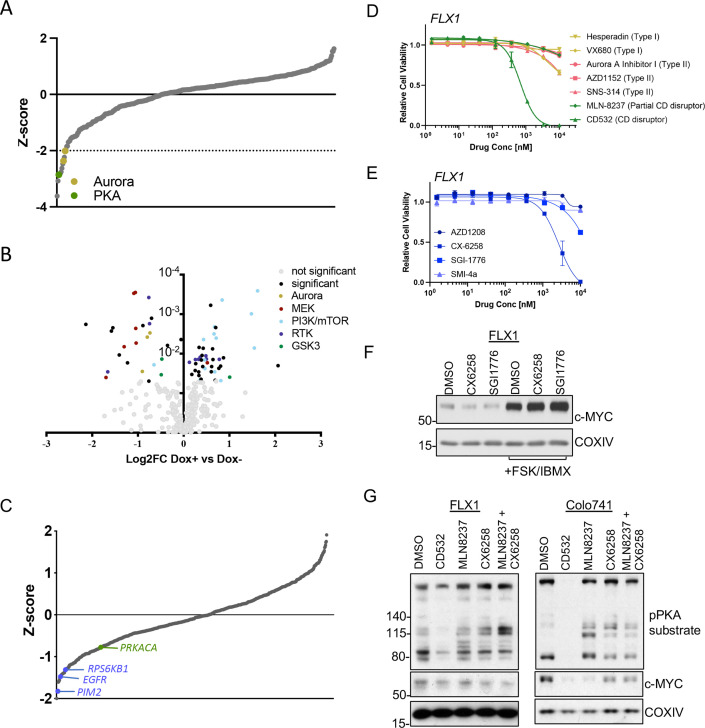
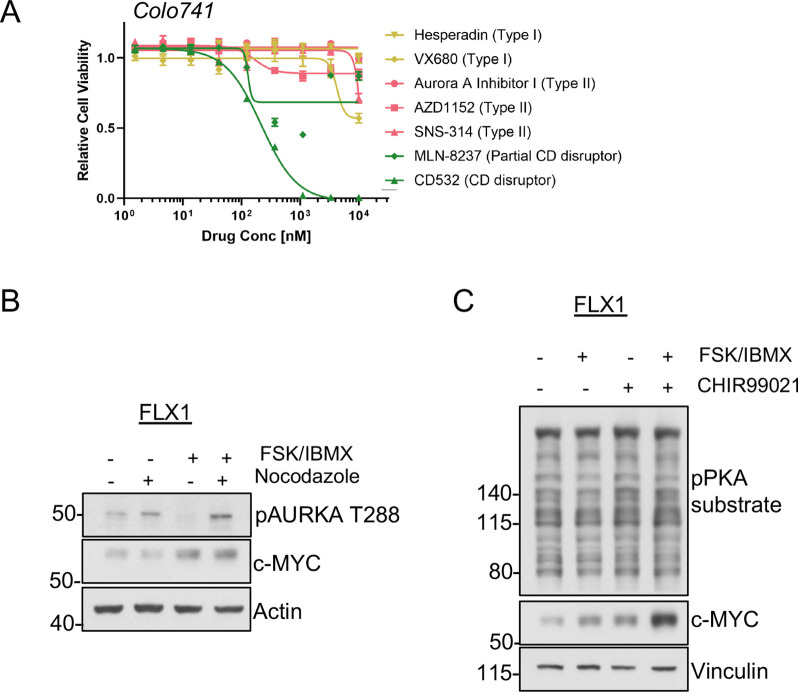
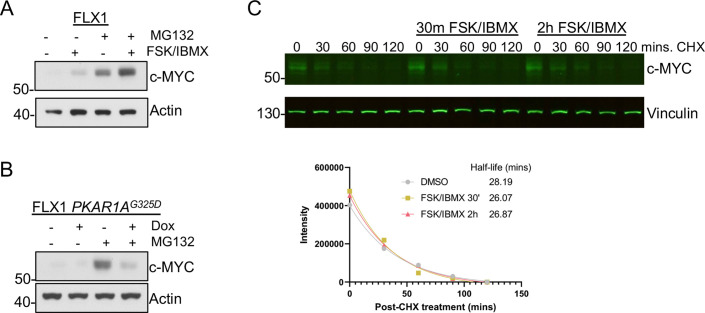
Figure 5. AURKA and GSK3B regulate c-MYC in PKA-dependent cell models.
(A) Summary data from the FLX1 cell line treated with 352 kinase inhibitors from an advanced clinical compound library at 2 μM for 120 hr. The targets of selected compounds with a z-score ≥2 are highlighted, with the PKA inhibiting tool compound H89 shown. Average of three biological replicates is shown. (B) Impact of doxycycline (dox) induction of 3xFLAG-PRKAR1AG325D on drug sensitivity in FLX1: Cells were incubated with 1 μg/ml dox overnight and compound added on the following day; log2FC vs. median was derived ± dox, and then subtracted to identify those compounds whose activity was altered by 3xFLAG-PRKAR1AG325D. Data are averaged from three biological replicates. Inhibitors with p<0.05 were marked. Selected inhibitors were color coded based on their targets. (C) Kinase pooled siRNA library screen with FLX1 in 384 well plates shows the effect of each target kinase on cell proliferation (average of four biological replicates). Selected non-metabolic kinases that decrease cell proliferation with z-score –1 were marked. (D) FLX1 cells treated with dose curves of multiple AURKA inhibitors for 120 hr. Relative cell viability was measured by CTG assay vs. untreated control samples. Results are the mean ± SEM of triple biological replicates, three technical replicates per biological replicate. Inhibitors are color coded based on their binding mode. (E) FLX1 cells treated with dose curves of multiple PIM inhibitors as in B. (F) Effect of 24 hr treatment with 5 μM of different PIM inhibitors ±4 hr treatment with 50 μM forskolin (FSK)/3-isobutyl-1-methylxanthine (IBMX). (G) Immunoblot showing the change of PKA activity, as indicated by phospho-PKA substrate, and c-MYC and n-MYC levels in Colo741 and FLX1 cells after treatment with DMSO, 1 μM CD532, MLN8237, CX6258, or combination of 1 μM MLN8237 and 1 μM CX6258 for 24 hr.


