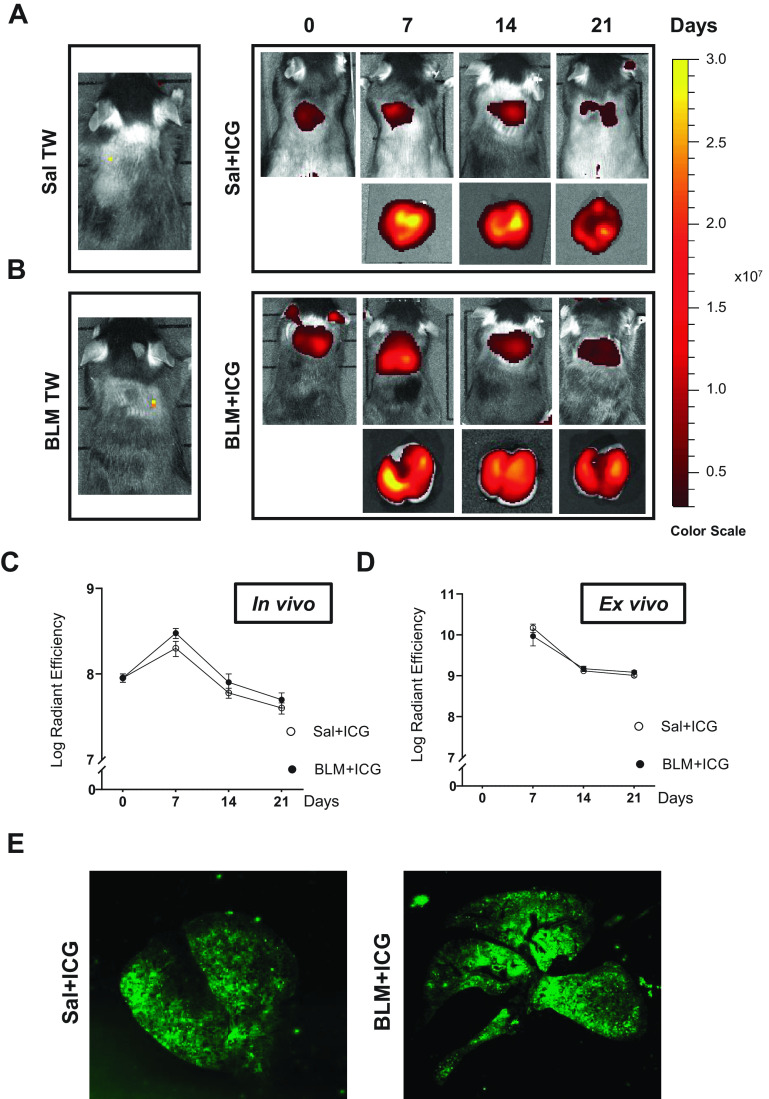
Figure 1.
In vivo and ex vivo fluorescence imaging. A: representative in vivo and ex vivo fluorescence images of Sal- and Sal+ICG-treated mice at 0, 7, 14, and 21 days after OA, as indicated. B: same as A for the BLM- and BLM+ICG-treated groups. C: time course of the in vivo quantified fluorescence signals. D: same as C for ex vivo quantified fluorescence signals. E: representative images acquired by near-infrared analysis (Odyssey scanner, LI-COR; see materials and methods for details) of paraffin-embedded lung slides from Sal+ICG- and BLM+ICG-treated animals. Data are given as means ± SE of three biological replicates. Numbers of animals (n) were as follows: Sal, Sal+ICG, and BLM groups, n = 5 for each time point; BLM+ICG groups, n = 12 for each time point. BLM, bleomycin; ICG, indocyanine green; OA, oropharyngeal aspiration; Sal, saline.

